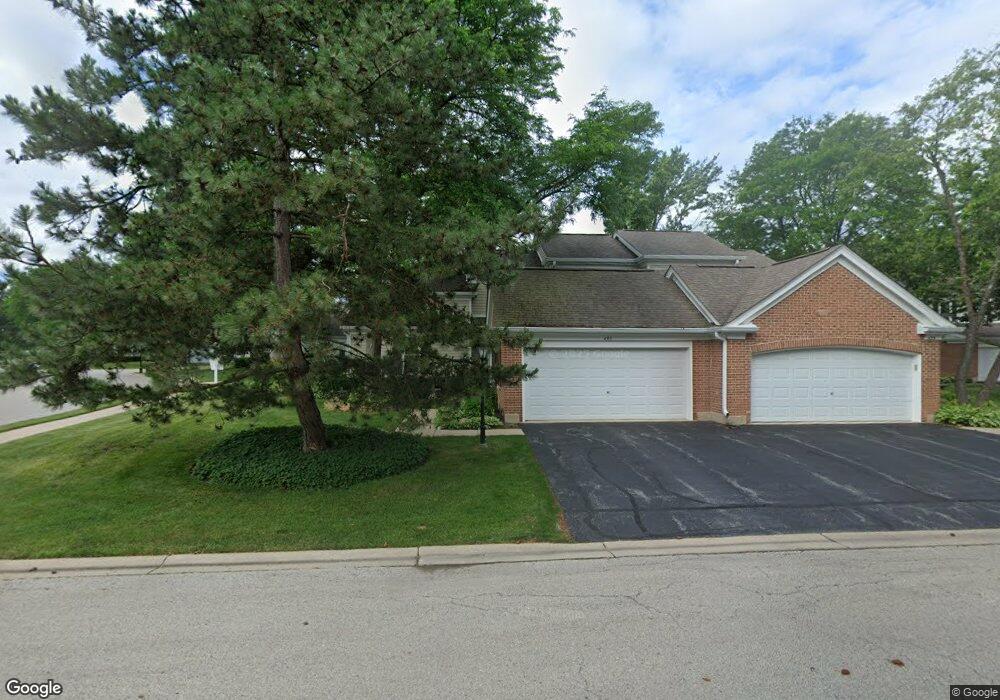
481 Greystone Ln Unit 12944 Prospect Heights, IL 60070
Estimated Value: $444,380 - $501,000
3
Beds
3
Baths
1,912
Sq Ft
$247/Sq Ft
Est. Value
About This Home
This home is located at 481 Greystone Ln Unit 12944, Prospect Heights, IL 60070 and is currently estimated at $472,345, approximately $247 per square foot. 481 Greystone Ln Unit 12944 is a home located in Cook County with nearby schools including Euclid Elementary School, River Trails Middle School, and John Hersey High School.
Ownership History
Date
Name
Owned For
Owner Type
Purchase Details
Closed on
Nov 6, 2012
Sold by
Hull Ann M and Hull Ann B
Bought by
Hull Ann M and Ann M Hull Declaration Of Trus
Current Estimated Value
Purchase Details
Closed on
Jul 16, 2010
Sold by
Hull Ann M and Hull Robert F
Bought by
Hull Ann B
Purchase Details
Closed on
Mar 20, 2009
Sold by
Bartmann Charles and Charles Bartmann Trust
Bought by
Hull Ann M
Home Financials for this Owner
Home Financials are based on the most recent Mortgage that was taken out on this home.
Original Mortgage
$225,000
Outstanding Balance
$142,918
Interest Rate
5.11%
Mortgage Type
Purchase Money Mortgage
Estimated Equity
$329,427
Purchase Details
Closed on
Aug 18, 2004
Sold by
Cutro Prudence and Sam Casano Self Declaration Tr
Bought by
Charles Bartmann Trust
Purchase Details
Closed on
Feb 10, 1995
Sold by
Casano Sam
Bought by
Casano Sam
Create a Home Valuation Report for This Property
The Home Valuation Report is an in-depth analysis detailing your home's value as well as a comparison with similar homes in the area
Home Values in the Area
Average Home Value in this Area
Purchase History
| Date | Buyer | Sale Price | Title Company |
|---|---|---|---|
| Hull Ann M | -- | None Available | |
| Hull Ann B | -- | None Available | |
| Hull Ann M | $320,000 | Chicago Title Insurance Co | |
| Charles Bartmann Trust | $395,000 | Multiple | |
| Casano Sam | -- | -- |
Source: Public Records
Mortgage History
| Date | Status | Borrower | Loan Amount |
|---|---|---|---|
| Open | Hull Ann M | $225,000 |
Source: Public Records
Tax History Compared to Growth
Tax History
| Year | Tax Paid | Tax Assessment Tax Assessment Total Assessment is a certain percentage of the fair market value that is determined by local assessors to be the total taxable value of land and additions on the property. | Land | Improvement |
|---|---|---|---|---|
| 2024 | $8,694 | $30,561 | $2,752 | $27,809 |
| 2023 | $8,127 | $30,561 | $2,752 | $27,809 |
| 2022 | $8,127 | $30,561 | $2,752 | $27,809 |
| 2021 | $7,580 | $25,290 | $859 | $24,431 |
| 2020 | $7,357 | $25,290 | $859 | $24,431 |
| 2019 | $7,406 | $28,331 | $859 | $27,472 |
| 2018 | $6,651 | $23,689 | $687 | $23,002 |
| 2017 | $6,580 | $23,689 | $687 | $23,002 |
| 2016 | $6,404 | $23,689 | $687 | $23,002 |
| 2015 | $5,923 | $20,652 | $1,375 | $19,277 |
| 2014 | $5,875 | $20,652 | $1,375 | $19,277 |
| 2013 | $5,716 | $20,652 | $1,375 | $19,277 |
Source: Public Records
Map
Nearby Homes
- 109 Rob Roy Ln Unit C
- 509 Aberdeen Ln Unit C
- 501 Aberdeen Ln Unit C
- 302 Lonsdale Rd
- 688 Glasgow Ln Unit 121133
- 603 Thistle Ln Unit 16185
- 212 Country Club Dr Unit 198
- 206 E Camp Mcdonald Rd
- 763 Sussex Corner Ln Unit 15
- 1214 N Crabtree Ln
- 1121 N Greenfield Ln
- 703 Newcastle Ln
- 203 Coldren Dr
- 1136 N Boxwood Dr
- 1116 N Westgate Rd
- 1120 N Boxwood Dr Unit B
- 1400 N Elmhurst Rd Unit 302
- 1400 N Elmhurst Rd Unit 106
- 107 W Brighton Place Unit T12
- 932 N Wheeling Rd
- 479 Greystone Ln Unit 12944
- 477 Greystone Ln Unit 12745
- 460 Williamsburg Ln Unit 128
- 480 Greystone Ln Unit 12749
- 109 Rob Roy Ln Unit 13158
- 109 Rob Roy Ln Unit 13158
- 109 Rob Roy Ln Unit 13158
- 109 Rob Roy Ln Unit 3C
- 109 Rob Roy Ln Unit D
- 109 Rob Roy Ln Unit B
- 478 Greystone Ln Unit 12749
- 475 Greystone Ln Unit 12745
- 458 Williamsburg Ln Unit 128
- 456 Williamsburg Ln Unit 128
- 476 Greystone Ln Unit 12948
- 101 Rob Roy Ln Unit D
- 101 Rob Roy Ln Unit B
- 101 Rob Roy Ln Unit 13158
- 101 Rob Roy Ln Unit 13158
- 101 Rob Roy Ln Unit 13158