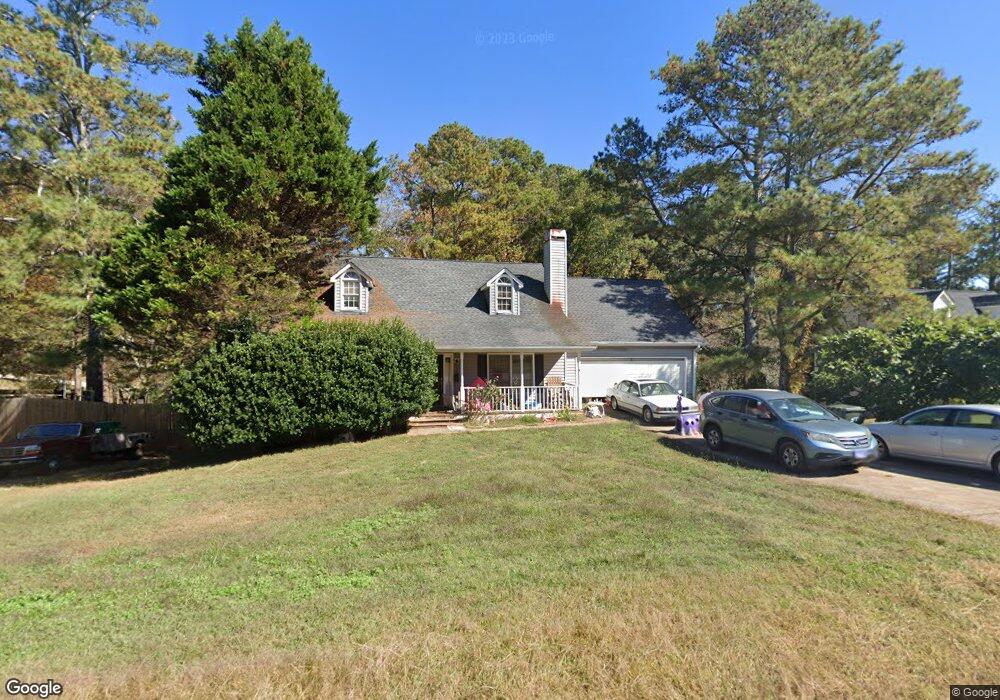
4814 Countryside Dr Flowery Branch, GA 30542
Estimated Value: $386,000 - $422,000
3
Beds
2
Baths
2,128
Sq Ft
$189/Sq Ft
Est. Value
About This Home
This home is located at 4814 Countryside Dr, Flowery Branch, GA 30542 and is currently estimated at $401,386, approximately $188 per square foot. 4814 Countryside Dr is a home located in Hall County with nearby schools including Chestnut Mountain Elementary School, South Hall Middle School, and Johnson High School.
Ownership History
Date
Name
Owned For
Owner Type
Purchase Details
Closed on
May 10, 2004
Sold by
Zamaryka Adam
Bought by
Zamaryka Adam and Zamaryka Barbara
Current Estimated Value
Purchase Details
Closed on
Apr 15, 2002
Sold by
Westmoreland Trenton M and Angela Christi
Bought by
Zamaryka Adam and Barbara Ann
Home Financials for this Owner
Home Financials are based on the most recent Mortgage that was taken out on this home.
Original Mortgage
$80,100
Interest Rate
6.89%
Mortgage Type
New Conventional
Purchase Details
Closed on
May 14, 1999
Sold by
Mayfield Marlon R and Mayfield Kris D
Bought by
Westmoreland Trenton M and Westmoreland A
Home Financials for this Owner
Home Financials are based on the most recent Mortgage that was taken out on this home.
Original Mortgage
$108,000
Interest Rate
6.98%
Mortgage Type
New Conventional
Purchase Details
Closed on
Jul 1, 1993
Purchase Details
Closed on
May 1, 1993
Create a Home Valuation Report for This Property
The Home Valuation Report is an in-depth analysis detailing your home's value as well as a comparison with similar homes in the area
Home Values in the Area
Average Home Value in this Area
Purchase History
| Date | Buyer | Sale Price | Title Company |
|---|---|---|---|
| Zamaryka Adam | -- | -- | |
| Zamaryka Adam | $155,000 | -- | |
| Westmoreland Trenton M | $138,000 | -- | |
| -- | $13,700 | -- | |
| -- | $13,500 | -- |
Source: Public Records
Mortgage History
| Date | Status | Borrower | Loan Amount |
|---|---|---|---|
| Previous Owner | Zamaryka Adam | $80,100 | |
| Previous Owner | Westmoreland Trenton M | $108,000 |
Source: Public Records
Tax History Compared to Growth
Tax History
| Year | Tax Paid | Tax Assessment Tax Assessment Total Assessment is a certain percentage of the fair market value that is determined by local assessors to be the total taxable value of land and additions on the property. | Land | Improvement |
|---|---|---|---|---|
| 2025 | $3,520 | $150,280 | $22,720 | $127,560 |
| 2024 | $3,875 | $153,680 | $20,640 | $133,040 |
| 2023 | $3,268 | $144,840 | $20,640 | $124,200 |
| 2022 | $3,146 | $119,120 | $18,680 | $100,440 |
| 2021 | $2,457 | $90,640 | $15,680 | $74,960 |
| 2020 | $2,531 | $90,880 | $15,400 | $75,480 |
| 2019 | $2,519 | $87,640 | $15,400 | $72,240 |
| 2018 | $2,090 | $69,560 | $11,920 | $57,640 |
| 2017 | $1,889 | $63,160 | $11,920 | $51,240 |
| 2016 | $1,845 | $63,120 | $11,920 | $51,200 |
| 2015 | $1,716 | $58,010 | $9,600 | $48,410 |
| 2014 | $1,716 | $58,010 | $9,600 | $48,410 |
Source: Public Records
Map
Nearby Homes
- 4998 Planters Way
- 5165 Strickland Rd
- 5214 Nimble Wood Way
- 4577 Winder Hwy
- 5306 Weeping Creek Trail
- 5392 Retreat Dr
- 5313 Founders Way Unit 36
- 5313 Founders Way
- 5314 Founders Way
- 5314 Founders Way Unit 35
- 5309 Founders Way
- 5356 Retreat Dr
- 4559 Winder Hwy
- 5377 Retreat Dr
- 5329 Retreat Dr
- 4211 Quail Creek Dr
- 5401 Bancroft Ln Unit 17A
- 4226 Quail Creek Dr
- 4810 Shadowood Way
- 4808 Countryside Dr
- 4820 Countryside Dr
- 4815 Countryside Dr
- 4811 Shadowood Way
- 4811 Countryside Dr
- 4819 Countryside Dr
- 4804 Countryside Dr
- 4807 Countryside Dr
- 4823 Countryside Dr
- 4807 Shadowood Way Unit 134
- 4807 Shadowood Way
- 4805 Brook Valley Ln
- 4714 Countryside Dr
- 4932 Planters Way
- 4919 Surrey Place
- 4718 Countryside Dr
- 4828 Countryside Dr
- 4803 Countryside Dr
- 4928 Planters Way