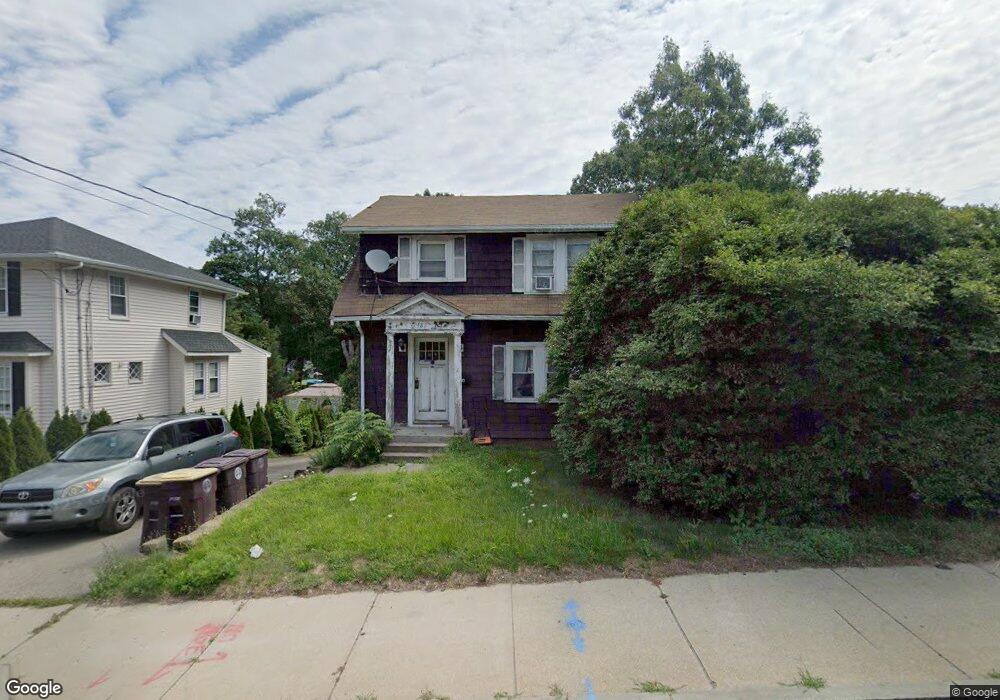
482 Main St South Weymouth, MA 02190
South Weymouth NeighborhoodEstimated Value: $570,000 - $653,000
3
Beds
2
Baths
1,564
Sq Ft
$395/Sq Ft
Est. Value
About This Home
This home is located at 482 Main St, South Weymouth, MA 02190 and is currently estimated at $618,505, approximately $395 per square foot. 482 Main St is a home located in Norfolk County with nearby schools including Thomas V Nash, Abigail Adams Middle School, and Weymouth Middle School Chapman.
Ownership History
Date
Name
Owned For
Owner Type
Purchase Details
Closed on
May 7, 2009
Sold by
Helen E Perkins T
Bought by
Anderson Daniel C and Anderson Tara C
Current Estimated Value
Home Financials for this Owner
Home Financials are based on the most recent Mortgage that was taken out on this home.
Original Mortgage
$188,650
Outstanding Balance
$119,514
Interest Rate
4.9%
Mortgage Type
Purchase Money Mortgage
Estimated Equity
$498,991
Create a Home Valuation Report for This Property
The Home Valuation Report is an in-depth analysis detailing your home's value as well as a comparison with similar homes in the area
Home Values in the Area
Average Home Value in this Area
Purchase History
| Date | Buyer | Sale Price | Title Company |
|---|---|---|---|
| Anderson Daniel C | $245,000 | -- |
Source: Public Records
Mortgage History
| Date | Status | Borrower | Loan Amount |
|---|---|---|---|
| Open | Anderson Daniel C | $188,650 |
Source: Public Records
Tax History Compared to Growth
Tax History
| Year | Tax Paid | Tax Assessment Tax Assessment Total Assessment is a certain percentage of the fair market value that is determined by local assessors to be the total taxable value of land and additions on the property. | Land | Improvement |
|---|---|---|---|---|
| 2025 | $4,598 | $455,200 | $176,800 | $278,400 |
| 2024 | $4,453 | $433,600 | $168,400 | $265,200 |
| 2023 | $4,509 | $431,500 | $175,400 | $256,100 |
| 2022 | $4,395 | $383,500 | $162,400 | $221,100 |
| 2021 | $3,879 | $330,400 | $144,400 | $186,000 |
| 2020 | $3,700 | $310,400 | $144,400 | $166,000 |
| 2019 | $3,609 | $297,800 | $138,800 | $159,000 |
| 2018 | $3,495 | $279,600 | $132,200 | $147,400 |
| 2017 | $3,296 | $257,300 | $125,900 | $131,400 |
| 2016 | $3,196 | $249,700 | $121,100 | $128,600 |
| 2015 | $3,126 | $242,300 | $121,100 | $121,200 |
| 2014 | $3,043 | $228,800 | $112,700 | $116,100 |
Source: Public Records
Map
Nearby Homes
- 2 Tara Dr Unit 1
- 2 Mitchell Ln Unit B
- 200 Justin Dr Unit 3
- 200 Burkhall St Unit 803
- 200 Burkhall St Unit 102
- 191 Tall Oaks Dr Unit C
- 116 Belmont St
- 255 West St
- 120 Burkhall St Unit K
- 262 West St
- 747 Middle St
- 27 Park Ave
- 110 Burkhall St Unit H
- 92 Mercury St
- 215 Winter St Unit 1P
- 25 Echo Ave
- 376 Pleasant St
- 261 Pleasant St Unit 3
- 261 Pleasant St Unit 5
- 501 Commerce Dr Unit 2310