Estimated Value: $232,000 - $305,000
3
Beds
2
Baths
1,756
Sq Ft
$155/Sq Ft
Est. Value
About This Home
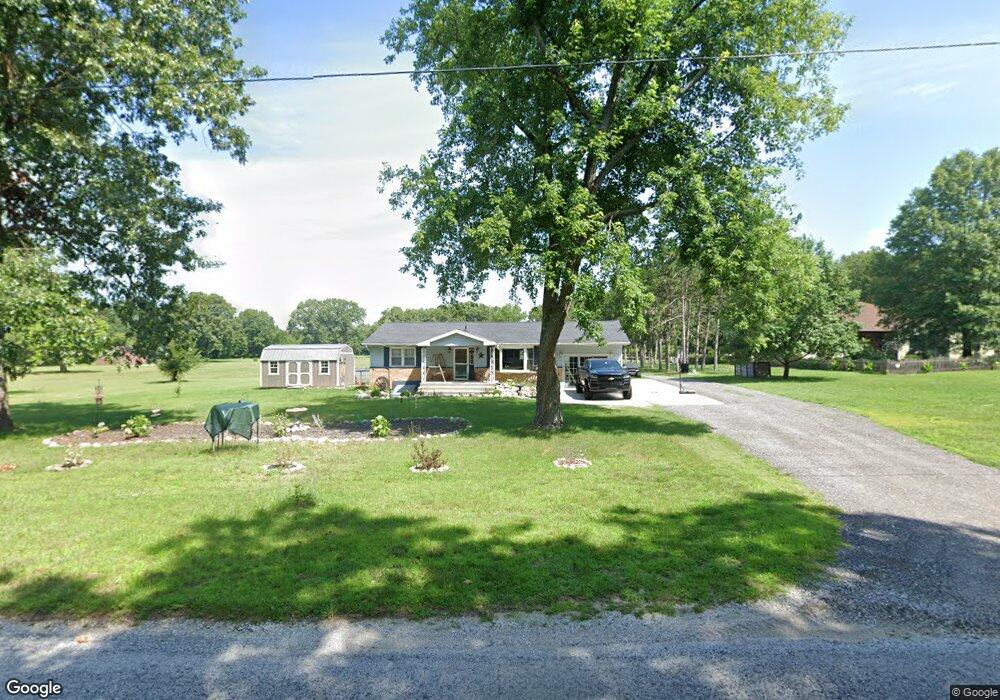
This home is located at 4820 E 150 N, Knox, IN 46534 and is currently estimated at $271,582, approximately $154 per square foot. 4820 E 150 N is a home located in Starke County with nearby schools including Knox Community Elementary School, Knox Community Middle School, and Knox Community High School.
Ownership History
Date
Name
Owned For
Owner Type
Purchase Details
Closed on
Nov 14, 2018
Sold by
Kain Candance L and Johnson Rhonda L
Bought by
Gomez Freddie
Current Estimated Value
Home Financials for this Owner
Home Financials are based on the most recent Mortgage that was taken out on this home.
Original Mortgage
$153,174
Outstanding Balance
$136,200
Interest Rate
5.37%
Mortgage Type
FHA
Estimated Equity
$135,382
Purchase Details
Closed on
Nov 20, 2017
Sold by
Nordstrom Betty
Bought by
Kain Candance L and Johnson Rhonda L
Purchase Details
Closed on
Feb 27, 2008
Sold by
Nordstrom Bruce and Nordstrom Betty
Bought by
Nordstrom Bruce and Nordstrom Betty
Create a Home Valuation Report for This Property
The Home Valuation Report is an in-depth analysis detailing your home's value as well as a comparison with similar homes in the area
Home Values in the Area
Average Home Value in this Area
Purchase History
| Date | Buyer | Sale Price | Title Company |
|---|---|---|---|
| Gomez Freddie | -- | Meridian Title Corp | |
| Kain Candance L | -- | None Available | |
| Nordstrom Bruce | -- | None Available |
Source: Public Records
Mortgage History
| Date | Status | Borrower | Loan Amount |
|---|---|---|---|
| Open | Gomez Freddie | $153,174 |
Source: Public Records
Tax History Compared to Growth
Tax History
| Year | Tax Paid | Tax Assessment Tax Assessment Total Assessment is a certain percentage of the fair market value that is determined by local assessors to be the total taxable value of land and additions on the property. | Land | Improvement |
|---|---|---|---|---|
| 2024 | $2,026 | $245,400 | $37,400 | $208,000 |
| 2023 | $2,016 | $222,000 | $32,000 | $190,000 |
| 2022 | $1,452 | $185,400 | $29,000 | $156,400 |
| 2021 | $1,286 | $157,100 | $27,200 | $129,900 |
| 2020 | $1,660 | $144,000 | $26,900 | $117,100 |
| 2019 | $1,571 | $135,800 | $26,400 | $109,400 |
| 2018 | $999 | $131,100 | $26,200 | $104,900 |
| 2017 | $966 | $126,600 | $25,900 | $100,700 |
| 2016 | $968 | $125,000 | $25,700 | $99,300 |
| 2014 | $606 | $114,400 | $26,200 | $88,200 |
| 2013 | $573 | $112,900 | $25,100 | $87,800 |
Source: Public Records
Map
Nearby Homes