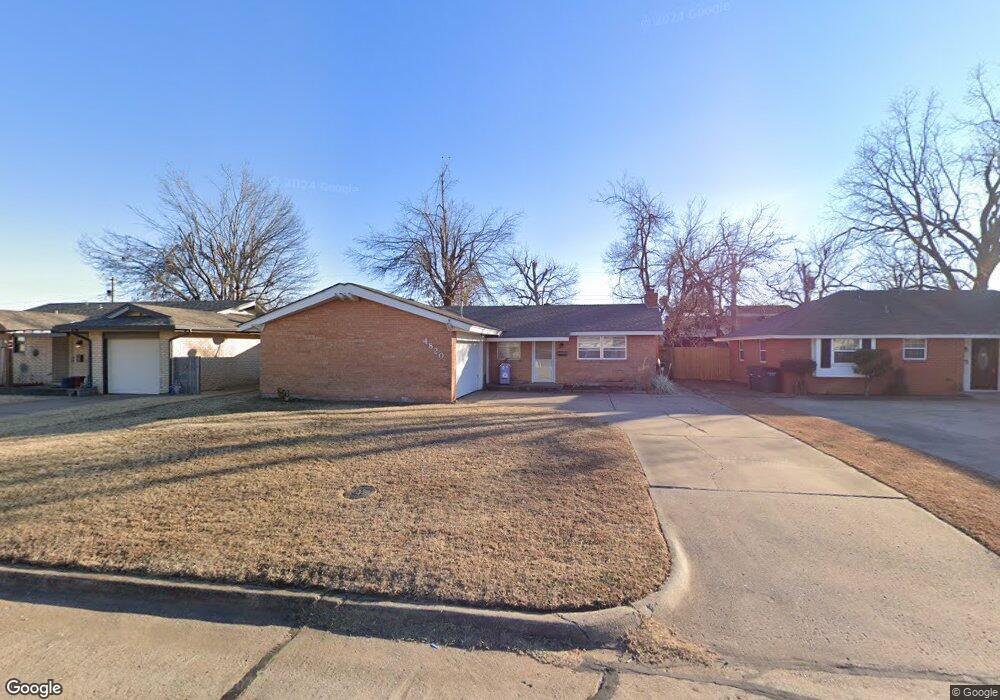
4820 Woodview Dr Oklahoma City, OK 73115
Estimated Value: $180,897 - $191,000
3
Beds
2
Baths
1,618
Sq Ft
$114/Sq Ft
Est. Value
About This Home
This home is located at 4820 Woodview Dr, Oklahoma City, OK 73115 and is currently estimated at $184,724, approximately $114 per square foot. 4820 Woodview Dr is a home located in Oklahoma County with nearby schools including Townsend Elementary School, Kerr Middle School, and Del City High School.
Ownership History
Date
Name
Owned For
Owner Type
Purchase Details
Closed on
May 17, 1999
Sold by
Whetsel John and White Douglas A
Bought by
Homecomings Financial Network
Current Estimated Value
Purchase Details
Closed on
Mar 3, 1999
Sold by
Homecomings Financial Network Inc
Bought by
Holder Brady Alan and Holder Rhea L
Home Financials for this Owner
Home Financials are based on the most recent Mortgage that was taken out on this home.
Original Mortgage
$43,700
Interest Rate
8.29%
Mortgage Type
Purchase Money Mortgage
Create a Home Valuation Report for This Property
The Home Valuation Report is an in-depth analysis detailing your home's value as well as a comparison with similar homes in the area
Home Values in the Area
Average Home Value in this Area
Purchase History
| Date | Buyer | Sale Price | Title Company |
|---|---|---|---|
| Homecomings Financial Network | -- | -- | |
| Holder Brady Alan | $46,000 | -- |
Source: Public Records
Mortgage History
| Date | Status | Borrower | Loan Amount |
|---|---|---|---|
| Previous Owner | Holder Brady Alan | $43,700 |
Source: Public Records
Tax History Compared to Growth
Tax History
| Year | Tax Paid | Tax Assessment Tax Assessment Total Assessment is a certain percentage of the fair market value that is determined by local assessors to be the total taxable value of land and additions on the property. | Land | Improvement |
|---|---|---|---|---|
| 2024 | $1,148 | $11,542 | $1,345 | $10,197 |
| 2023 | $1,148 | $11,206 | $1,464 | $9,742 |
| 2022 | $1,094 | $10,879 | $1,556 | $9,323 |
| 2021 | $1,097 | $10,562 | $1,701 | $8,861 |
| 2020 | $1,090 | $10,255 | $1,760 | $8,495 |
| 2019 | $1,023 | $9,957 | $1,644 | $8,313 |
| 2018 | $1,004 | $9,667 | $0 | $0 |
| 2017 | $978 | $9,385 | $2,162 | $7,223 |
| 2016 | $1,073 | $9,949 | $2,136 | $7,813 |
| 2015 | $1,044 | $9,660 | $2,207 | $7,453 |
| 2014 | $1,007 | $9,378 | $2,129 | $7,249 |
Source: Public Records
Map
Nearby Homes
- 4809 Elmview Dr
- 4813 Elmview Dr
- 3128 Del View Dr
- 3413 Del View Dr
- 3500 Del View Dr
- 4853 Montclair Dr
- 4700 Elmview Dr
- 4704 Tempo Dr
- 4729 SE 27th St
- 4540 SE 35th St
- 4809 SE 41st St
- 4732 Princess Ln
- 4113 Vickie Dr
- 4625 SE 42nd St
- 4521 SE 27th St
- 4760 SE 23rd St
- 4601 SE 26th St
- 4736 SE 23rd St
- 4428 SE 38th St
- 4620 SE 24th St
- 4824 Woodview Dr
- 4816 Woodview Dr
- 4828 Woodview Dr
- 4812 Woodview Dr
- 4821 Newport Dr
- 4825 Newport Dr
- 4817 Newport Dr
- 4829 Newport Dr
- 4821 Woodview Dr
- 4832 Woodview Dr
- 4817 Woodview Dr
- 4813 Newport Dr
- 4825 Woodview Dr
- 4813 Woodview Dr
- 4833 Newport Dr
- 4829 Woodview Dr
- 4809 Newport Dr
- 4836 Woodview Dr
- 4809 Woodview Dr
- 4833 Woodview Dr