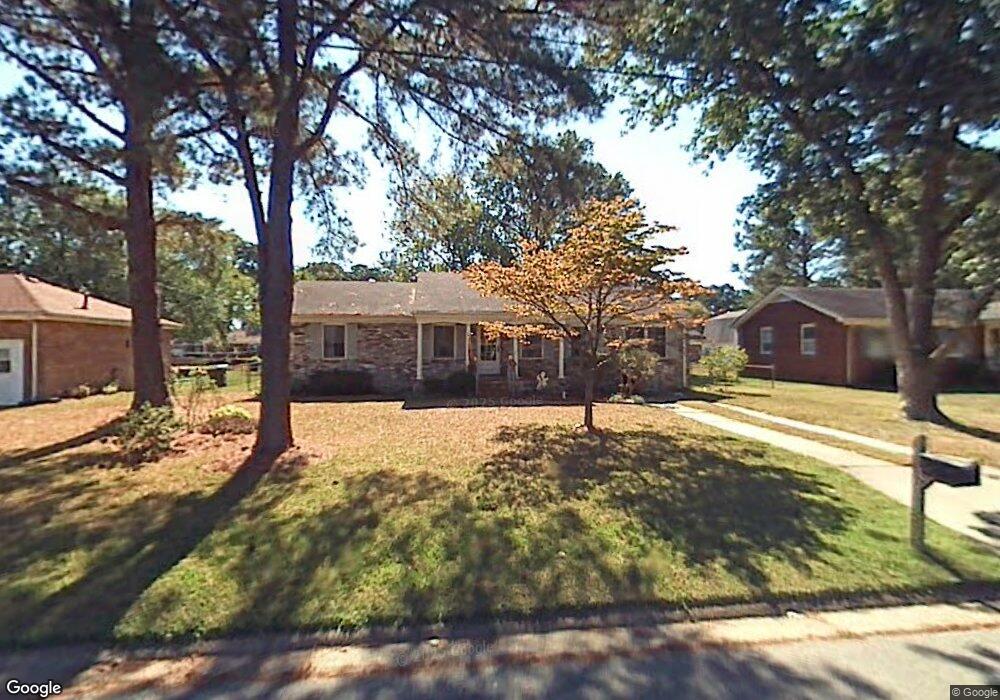
4821 Orleans Dr Portsmouth, VA 23703
Churchland NeighborhoodEstimated Value: $300,000 - $332,000
3
Beds
2
Baths
1,539
Sq Ft
$205/Sq Ft
Est. Value
About This Home
This home is located at 4821 Orleans Dr, Portsmouth, VA 23703 and is currently estimated at $314,820, approximately $204 per square foot. 4821 Orleans Dr is a home located in Portsmouth City with nearby schools including Churchland Elementary School, Churchland Academy Elementary School, and Churchland Middle School.
Ownership History
Date
Name
Owned For
Owner Type
Purchase Details
Closed on
Jul 15, 2024
Sold by
Creech Michael C and Booth-Creech Elizabeth
Bought by
Adkins Madison and Key Austin J
Current Estimated Value
Home Financials for this Owner
Home Financials are based on the most recent Mortgage that was taken out on this home.
Original Mortgage
$271,719
Outstanding Balance
$268,232
Interest Rate
6.99%
Mortgage Type
VA
Estimated Equity
$46,588
Purchase Details
Closed on
Sep 25, 2020
Sold by
Creech Michael C
Bought by
Creech Michael C and Booth-Creech Elizabeth
Purchase Details
Closed on
Mar 29, 2018
Sold by
Poole Sandra N and Poole Michael C
Bought by
Creech Michael C
Home Financials for this Owner
Home Financials are based on the most recent Mortgage that was taken out on this home.
Original Mortgage
$159,953
Interest Rate
4.38%
Mortgage Type
New Conventional
Purchase Details
Closed on
Aug 29, 2016
Sold by
The Sandra N Poole Revocable Trust Dated
Bought by
Poole Michael C and Arnette Leslie P
Create a Home Valuation Report for This Property
The Home Valuation Report is an in-depth analysis detailing your home's value as well as a comparison with similar homes in the area
Home Values in the Area
Average Home Value in this Area
Purchase History
| Date | Buyer | Sale Price | Title Company |
|---|---|---|---|
| Adkins Madison | $266,000 | Fidelity National Title | |
| Creech Michael C | -- | None Available | |
| Creech Michael C | $164,900 | True North Title | |
| Poole Michael C | -- | None Available |
Source: Public Records
Mortgage History
| Date | Status | Borrower | Loan Amount |
|---|---|---|---|
| Open | Adkins Madison | $271,719 | |
| Previous Owner | Creech Michael C | $159,953 |
Source: Public Records
Tax History Compared to Growth
Tax History
| Year | Tax Paid | Tax Assessment Tax Assessment Total Assessment is a certain percentage of the fair market value that is determined by local assessors to be the total taxable value of land and additions on the property. | Land | Improvement |
|---|---|---|---|---|
| 2025 | $2,374 | $251,110 | $77,760 | $173,350 |
| 2024 | $2,374 | $243,460 | $77,760 | $165,700 |
| 2023 | $3,135 | $237,090 | $77,760 | $159,330 |
| 2022 | $2,665 | $205,010 | $64,800 | $140,210 |
| 2021 | $2,273 | $174,840 | $46,100 | $128,740 |
| 2020 | $2,244 | $172,650 | $43,910 | $128,740 |
| 2019 | $2,228 | $171,370 | $43,910 | $127,460 |
| 2018 | $2,178 | $167,550 | $43,910 | $123,640 |
| 2017 | $2,145 | $165,000 | $43,910 | $121,090 |
| 2016 | $2,145 | $165,000 | $43,910 | $121,090 |
| 2015 | $2,145 | $165,000 | $43,910 | $121,090 |
| 2014 | $2,095 | $165,000 | $43,910 | $121,090 |
Source: Public Records
Map
Nearby Homes
- 10AC Cedar Ln
- 4955 Briarwood Ln
- 4959 Briarwood Ln
- 3728 Cardinal Ln
- 5300 Larkspur Rd
- 4808 Thornwood St
- 3613 Cardinal Ln
- 4613 Mallard Crescent
- 3609 Linnet Ln
- 3509 Spence Rd
- 3609 Loon Ct
- 4705 Templar Dr
- 4008 Oakhurst Rd
- 3425 Cedar Ln
- 3315 Camellia Dr
- 2004 Sawgrass Ln
- 3405 Canterbury Dr
- 5516 Bingham Dr
- 3408 Wakefield Dr
- 3604 Lilac Dr
- 4817 Orleans Dr
- 4825 Orleans Dr
- 4816 Morro Blvd
- 4812 Morro Blvd
- 4820 Morro Blvd
- 4813 Orleans Dr
- 4829 Orleans Dr
- 4820 Orleans Dr
- 4824 Orleans Dr
- 4816 Orleans Dr
- 4808 Morro Blvd
- 4824 Morro Blvd
- 4809 Orleans Dr
- 4828 Orleans Dr
- 4812 Orleans Dr
- 4804 Morro Blvd
- 4829 Wycliff Rd
- 4833 Wycliff Rd
- 4825 Wycliff Rd
- 4808 Orleans Dr