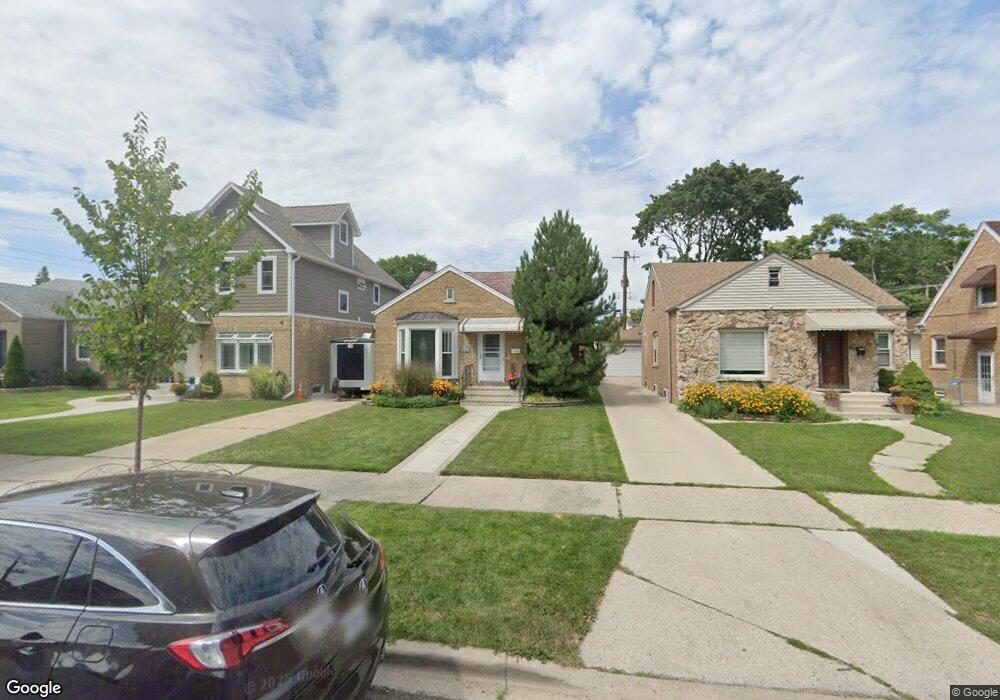
4822 N Mobile Ave Chicago, IL 60630
Jefferson Park NeighborhoodEstimated Value: $406,520 - $437,000
2
Beds
1
Bath
970
Sq Ft
$431/Sq Ft
Est. Value
About This Home
This home is located at 4822 N Mobile Ave, Chicago, IL 60630 and is currently estimated at $417,880, approximately $430 per square foot. 4822 N Mobile Ave is a home located in Cook County with nearby schools including Garvy J Elementary School, William Howard Taft High School, and St. Constance School.
Ownership History
Date
Name
Owned For
Owner Type
Purchase Details
Closed on
Feb 7, 2008
Sold by
Oles Allen
Bought by
Bigos Sylwester and Bigos Malgorzata
Current Estimated Value
Home Financials for this Owner
Home Financials are based on the most recent Mortgage that was taken out on this home.
Original Mortgage
$220,000
Outstanding Balance
$139,132
Interest Rate
6.11%
Mortgage Type
Unknown
Estimated Equity
$278,748
Purchase Details
Closed on
Mar 29, 2006
Sold by
Hayashi Megumi
Bought by
Oles Allen
Purchase Details
Closed on
Oct 16, 2002
Sold by
Oles Allen M
Bought by
Oles Allen M and Oles Megumi
Home Financials for this Owner
Home Financials are based on the most recent Mortgage that was taken out on this home.
Original Mortgage
$196,000
Interest Rate
6.29%
Purchase Details
Closed on
Mar 19, 2001
Sold by
Drazdauskas Edward A and Drazdauskas Mary Jane E
Bought by
Oles Allen M and Hayashi Megumi
Home Financials for this Owner
Home Financials are based on the most recent Mortgage that was taken out on this home.
Original Mortgage
$195,700
Interest Rate
6.95%
Create a Home Valuation Report for This Property
The Home Valuation Report is an in-depth analysis detailing your home's value as well as a comparison with similar homes in the area
Home Values in the Area
Average Home Value in this Area
Purchase History
| Date | Buyer | Sale Price | Title Company |
|---|---|---|---|
| Bigos Sylwester | $275,000 | Republic Title Co | |
| Oles Allen | -- | None Available | |
| Oles Allen M | -- | -- | |
| Oles Allen M | $206,000 | -- |
Source: Public Records
Mortgage History
| Date | Status | Borrower | Loan Amount |
|---|---|---|---|
| Open | Bigos Sylwester | $220,000 | |
| Previous Owner | Oles Allen M | $196,000 | |
| Previous Owner | Oles Allen M | $195,700 |
Source: Public Records
Tax History Compared to Growth
Tax History
| Year | Tax Paid | Tax Assessment Tax Assessment Total Assessment is a certain percentage of the fair market value that is determined by local assessors to be the total taxable value of land and additions on the property. | Land | Improvement |
|---|---|---|---|---|
| 2024 | $5,634 | $32,000 | $12,090 | $19,910 |
| 2023 | $5,471 | $30,000 | $9,672 | $20,328 |
| 2022 | $5,471 | $30,000 | $9,672 | $20,328 |
| 2021 | $5,367 | $30,004 | $9,676 | $20,328 |
| 2020 | $4,680 | $24,099 | $6,045 | $18,054 |
| 2019 | $4,694 | $26,777 | $6,045 | $20,732 |
| 2018 | $4,613 | $26,777 | $6,045 | $20,732 |
| 2017 | $4,107 | $22,442 | $5,319 | $17,123 |
| 2016 | $3,997 | $22,442 | $5,319 | $17,123 |
| 2015 | $3,851 | $23,624 | $5,319 | $18,305 |
| 2014 | $3,565 | $21,769 | $4,836 | $16,933 |
| 2013 | $3,484 | $21,769 | $4,836 | $16,933 |
Source: Public Records
Map
Nearby Homes
- 6316 W Lawrence Ave
- 6352 W Giddings St
- 6228 W Lawrence Ave
- 6420 W Gunnison St
- 6140 W Gunnison St Unit 3
- 4824 N Natchez Ave
- 5000 N Mobile Ave
- 6520 W Gunnison St
- 5044 N Merrimac Ave
- 6137 W Giddings St
- 4886 N Austin Ave
- 6046 W Giddings St
- 4567 N Merrimac Ave
- 4544 N Mulligan Ave
- 4546 N Merrimac Ave
- 4526 N Mobile Ave
- 4841 N Rutherford Ave
- 5915 W Gunnison St Unit 2F
- 4702 N Austin Ave Unit 302
- 5921 W Lawrence Ave
- 4826 N Mobile Ave
- 4818 N Mobile Ave
- 4814 N Mobile Ave
- 4830 N Mobile Ave
- 4834 N Mobile Ave
- 4823 N Mulligan Ave
- 4827 N Mulligan Ave
- 4819 N Mulligan Ave
- 4831 N Mulligan Ave
- 4815 N Mulligan Ave
- 4840 N Mobile Ave
- 6304 W Gunnison St
- 6308 W Gunnison St
- 6300 W Gunnison St
- 4835 N Mulligan Ave
- 4825 N Mobile Ave
- 4821 N Mobile Ave
- 6312 W Gunnison St
- 4819 N Mobile Ave
- 4829 N Mobile Ave