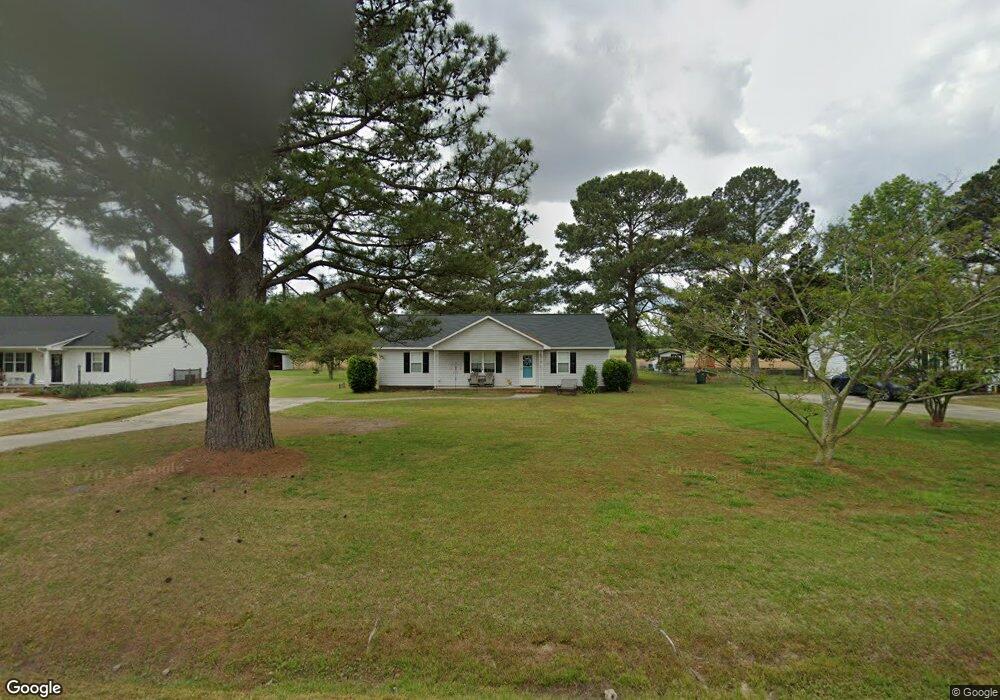
4831 Washington St La Grange, NC 28551
Estimated Value: $148,000 - $199,000
3
Beds
2
Baths
1,344
Sq Ft
$130/Sq Ft
Est. Value
About This Home
This home is located at 4831 Washington St, La Grange, NC 28551 and is currently estimated at $174,388, approximately $129 per square foot. 4831 Washington St is a home located in Lenoir County with nearby schools including La Grange Elementary School, E.B. Frink Middle School, and North Lenoir High School.
Ownership History
Date
Name
Owned For
Owner Type
Purchase Details
Closed on
Sep 27, 2007
Sold by
Mercer David G and Mercer Margaret
Bought by
Zorbaugh David E and Zorbaugh Lea Ann
Current Estimated Value
Home Financials for this Owner
Home Financials are based on the most recent Mortgage that was taken out on this home.
Original Mortgage
$74,693
Outstanding Balance
$47,291
Interest Rate
6.57%
Mortgage Type
New Conventional
Estimated Equity
$127,097
Purchase Details
Closed on
Aug 9, 2007
Sold by
Us Bank National Trust Assn
Bought by
Mercer David G
Home Financials for this Owner
Home Financials are based on the most recent Mortgage that was taken out on this home.
Original Mortgage
$74,693
Outstanding Balance
$47,291
Interest Rate
6.57%
Mortgage Type
New Conventional
Estimated Equity
$127,097
Purchase Details
Closed on
Feb 20, 2007
Sold by
Eubanks Walter Bland and Eubanks Christina Lynn
Bought by
Us Bank National Assocaition
Create a Home Valuation Report for This Property
The Home Valuation Report is an in-depth analysis detailing your home's value as well as a comparison with similar homes in the area
Home Values in the Area
Average Home Value in this Area
Purchase History
| Date | Buyer | Sale Price | Title Company |
|---|---|---|---|
| Zorbaugh David E | $74,000 | None Available | |
| Mercer David G | $62,000 | None Available | |
| Us Bank National Assocaition | $79,500 | None Available |
Source: Public Records
Mortgage History
| Date | Status | Borrower | Loan Amount |
|---|---|---|---|
| Open | Zorbaugh David E | $74,693 |
Source: Public Records
Tax History Compared to Growth
Tax History
| Year | Tax Paid | Tax Assessment Tax Assessment Total Assessment is a certain percentage of the fair market value that is determined by local assessors to be the total taxable value of land and additions on the property. | Land | Improvement |
|---|---|---|---|---|
| 2025 | $1,055 | $143,900 | $13,835 | $130,065 |
| 2024 | $760 | $82,153 | $11,580 | $70,573 |
| 2023 | $727 | $82,153 | $11,580 | $70,573 |
| 2022 | $727 | $82,153 | $11,580 | $70,573 |
| 2021 | $727 | $82,153 | $11,580 | $70,573 |
| 2020 | $727 | $82,153 | $11,580 | $70,573 |
| 2019 | $727 | $82,153 | $11,580 | $70,573 |
| 2018 | $715 | $82,153 | $11,580 | $70,573 |
| 2017 | $719 | $82,153 | $11,580 | $70,573 |
| 2014 | $797 | $91,104 | $11,581 | $79,523 |
| 2013 | -- | $91,104 | $11,581 | $79,523 |
| 2011 | -- | $91,104 | $11,581 | $79,523 |
Source: Public Records
Map
Nearby Homes
- 101 Forest Dr
- Hayden Plan at Blair Ridge
- Freeport Plan at Blair Ridge
- Cali Plan at Blair Ridge
- Belhaven Plan at Blair Ridge
- 6272 Highway 70 E
- 210 Wood St
- 201 Wood St
- 202 Wood St
- 208 Wood St
- 217 Wood St
- 204 Wood St
- 205 Wood St
- 206 Wood St
- 3619 S Caswell St
- 303 E James St
- 219 Wood St
- 4725 Packhouse Rd
- 202 E Washington St
- 614 S Caswell St
- 4819 Washington St
- 4849 Washington St
- 103 Amanda Dawn Cir Unit 36
- 104 Patrick Sydney Place
- 103 Patrick Sydney Place Unit 87
- 103 Patrick Sydney Place Unit 45
- 103 Patrick Sydney Place
- 608 Madison Ann Dr Unit 41
- 102 Patrick Sydney Place
- 104 Patrick Sydney Place Unit Lot 43
- 102 Patrick Sydney Place Unit Lot 42
- 604 Madison Ann Dr Unit Lot 39
- 103 Michael Thomas Place
- 101 Michael Thomas Place
- 604 Madison Ann Dr
- 606 Madison Ann Dr Unit Lot 40
- 608 Madison Ann Dr
- 102 Amanda Dawn Cir Unit 35
- 602 Madison Ann Dr Unit Lot 38
- 602 Madison Ann Dr