Estimated Value: $92,687 - $111,000
2
Beds
1
Bath
900
Sq Ft
$114/Sq Ft
Est. Value
About This Home
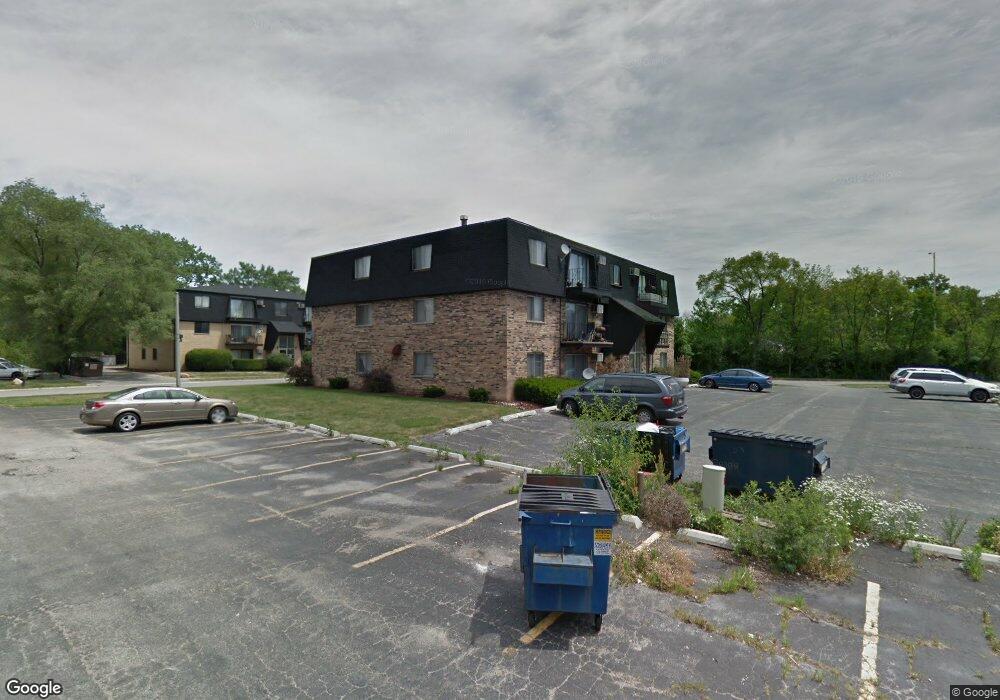
This home is located at 4839 W Engle Rd Unit 3A, Alsip, IL 60803 and is currently estimated at $102,422, approximately $113 per square foot. 4839 W Engle Rd Unit 3A is a home located in Cook County with nearby schools including Nathan Hale Primary School, Nathan Hale Intermediate School, and Nathan Hale Middle School.
Ownership History
Date
Name
Owned For
Owner Type
Purchase Details
Closed on
Jun 20, 2005
Sold by
United Guaranty Residential Insurance Co
Bought by
Mercado Areli and Mercado Magali
Current Estimated Value
Home Financials for this Owner
Home Financials are based on the most recent Mortgage that was taken out on this home.
Original Mortgage
$78,000
Interest Rate
5.89%
Mortgage Type
Fannie Mae Freddie Mac
Purchase Details
Closed on
Feb 22, 2005
Sold by
Federal Home Loan Mortgage Corporation
Bought by
United Guaranty Residential Insurance Co
Purchase Details
Closed on
Sep 16, 2004
Sold by
Barnhouse Jon
Bought by
Federal Home Loan Mortgage Corporation
Purchase Details
Closed on
May 25, 2001
Sold by
Elguindy Samir M and Elguindy Hoda S
Bought by
Barnhouse Jon and Vrablic Kelly
Home Financials for this Owner
Home Financials are based on the most recent Mortgage that was taken out on this home.
Original Mortgage
$70,300
Interest Rate
7.23%
Create a Home Valuation Report for This Property
The Home Valuation Report is an in-depth analysis detailing your home's value as well as a comparison with similar homes in the area
Home Values in the Area
Average Home Value in this Area
Purchase History
| Date | Buyer | Sale Price | Title Company |
|---|---|---|---|
| Mercado Areli | $88,000 | First American Title | |
| United Guaranty Residential Insurance Co | -- | First American Title Ins Co | |
| Federal Home Loan Mortgage Corporation | -- | -- | |
| Barnhouse Jon | $74,000 | -- |
Source: Public Records
Mortgage History
| Date | Status | Borrower | Loan Amount |
|---|---|---|---|
| Previous Owner | Mercado Areli | $78,000 | |
| Previous Owner | Barnhouse Jon | $70,300 |
Source: Public Records
Tax History Compared to Growth
Tax History
| Year | Tax Paid | Tax Assessment Tax Assessment Total Assessment is a certain percentage of the fair market value that is determined by local assessors to be the total taxable value of land and additions on the property. | Land | Improvement |
|---|---|---|---|---|
| 2024 | $1,433 | $7,305 | $838 | $6,467 |
| 2023 | $1,297 | $7,305 | $838 | $6,467 |
| 2022 | $1,297 | $6,402 | $1,219 | $5,183 |
| 2021 | $1,271 | $6,401 | $1,218 | $5,183 |
| 2020 | $1,334 | $6,401 | $1,218 | $5,183 |
| 2019 | $2,083 | $8,428 | $1,104 | $7,324 |
| 2018 | $2,004 | $8,428 | $1,104 | $7,324 |
| 2017 | $2,067 | $8,428 | $1,104 | $7,324 |
| 2016 | $1,704 | $6,590 | $913 | $5,677 |
| 2015 | $1,620 | $6,590 | $913 | $5,677 |
| 2014 | $1,595 | $6,590 | $913 | $5,677 |
| 2013 | $1,741 | $7,424 | $913 | $6,511 |
Source: Public Records
Map
Nearby Homes
- 12730 S Mcdaniels St
- 13053 S Mcdaniels Ct
- 4690 W 130th Ct
- 12738 S Kenneth Ave Unit E
- 12736 S Kenneth Ave Unit 1A
- 4833 W 123rd Place
- 4406 W 127th Place
- 12417 S Orchard St
- 4343 W Emerald Way St
- 4336 W Emerald Way St
- 12828 Terrace Ln
- 13125 E Playfield Dr
- 4309 W Park Lane Dr Unit 2B
- 13231 E Playfield Dr
- 13300 W Circle Drive Pkwy Unit G222
- 12211 S Spencer St
- 4735 W 122nd St
- 4804 W 118th St
- 4808 W 118th St
- 12549 S Tripp Ave
- 4839 W Engle Rd Unit 3B
- 4839 W Engle Rd Unit 2C
- 4839 W Engle Rd Unit 2B
- 4839 W Engle Rd Unit 1C
- 4839 W Engle Rd Unit 1B
- 4839 W Engle Rd Unit 3C
- 4839 W Engle Rd Unit 1A
- 4839 W Engle Rd Unit 2D
- 4839 W Engle Rd Unit 3D
- 4839 W Engle Rd Unit 1D
- 4839 W Engle Rd Unit 2A
- 4839 W Engle Rd Unit 2N
- 4829 W Engle Rd Unit 1D
- 4829 W Engle Rd Unit 3D
- 4829 W Engle Rd Unit 3C
- 4829 W Engle Rd Unit 2D
- 4829 W Engle Rd Unit 2B
- 4829 W Engle Rd Unit 2C
- 4829 W Engle Rd Unit 3A
- 4829 W Engle Rd Unit 1A