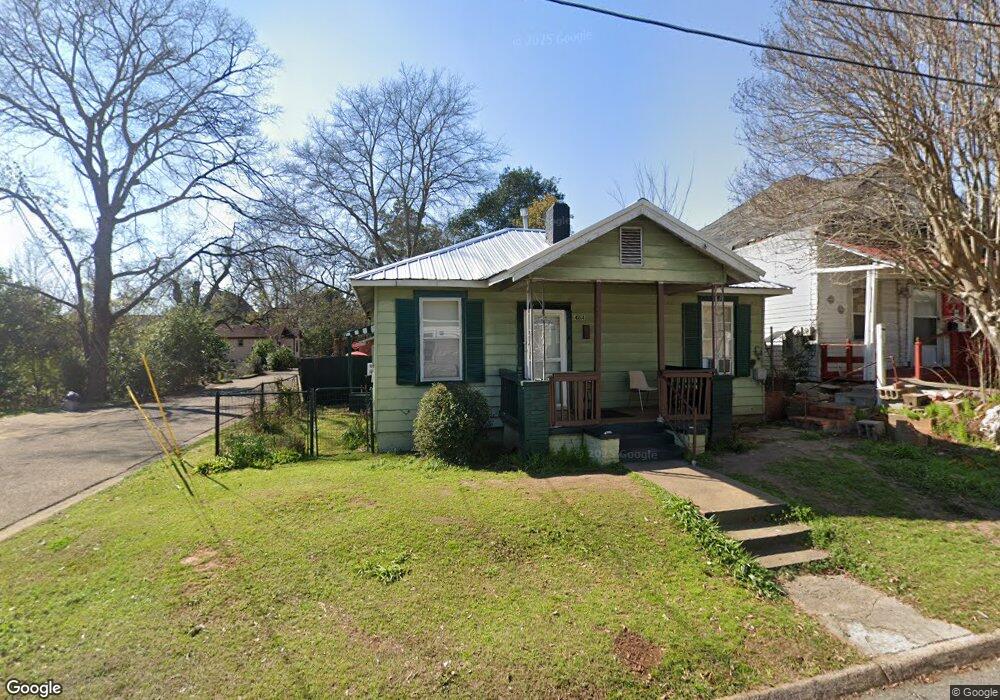
484 Ross St Montgomery, AL 36104
Estimated Value: $36,000 - $68,000
--
Bed
--
Bath
980
Sq Ft
$52/Sq Ft
Est. Value
About This Home
This home is located at 484 Ross St, Montgomery, AL 36104 and is currently estimated at $50,669, approximately $51 per square foot. 484 Ross St is a home located in Montgomery County with nearby schools including Highland Avenue Elementary School, Capitol Heights Middle School, and Dr. Percy L. Julian High School.
Ownership History
Date
Name
Owned For
Owner Type
Purchase Details
Closed on
May 7, 2025
Sold by
Turner Harry W
Bought by
Varner Vincent
Current Estimated Value
Home Financials for this Owner
Home Financials are based on the most recent Mortgage that was taken out on this home.
Original Mortgage
$64,000
Outstanding Balance
$63,715
Interest Rate
6.64%
Mortgage Type
New Conventional
Estimated Equity
-$13,046
Purchase Details
Closed on
Nov 14, 2004
Sold by
Turner Octavia and Turner Rashim
Bought by
Consultants Network Investment Unlimited
Purchase Details
Closed on
May 24, 2000
Sold by
Turner Rashim
Bought by
Turner Octavia
Home Financials for this Owner
Home Financials are based on the most recent Mortgage that was taken out on this home.
Original Mortgage
$25,600
Interest Rate
8.54%
Purchase Details
Closed on
Apr 29, 1999
Sold by
Harry Turner
Bought by
Turner Octavia and Turner Rashim
Create a Home Valuation Report for This Property
The Home Valuation Report is an in-depth analysis detailing your home's value as well as a comparison with similar homes in the area
Home Values in the Area
Average Home Value in this Area
Purchase History
| Date | Buyer | Sale Price | Title Company |
|---|---|---|---|
| Varner Vincent | $67,000 | None Listed On Document | |
| Varner Vincent | $67,000 | None Listed On Document | |
| Consultants Network Investment Unlimited | -- | -- | |
| Turner Octavia | $500 | -- | |
| Turner Octavia | -- | Cahaba Title Inc |
Source: Public Records
Mortgage History
| Date | Status | Borrower | Loan Amount |
|---|---|---|---|
| Open | Varner Vincent | $64,000 | |
| Closed | Varner Vincent | $64,000 | |
| Previous Owner | Turner Octavia | $25,600 |
Source: Public Records
Tax History Compared to Growth
Tax History
| Year | Tax Paid | Tax Assessment Tax Assessment Total Assessment is a certain percentage of the fair market value that is determined by local assessors to be the total taxable value of land and additions on the property. | Land | Improvement |
|---|---|---|---|---|
| 2025 | $195 | $3,920 | $680 | $3,240 |
| 2024 | $195 | $3,920 | $680 | $3,240 |
| 2023 | $195 | $3,920 | $680 | $3,240 |
| 2022 | $143 | $3,920 | $680 | $3,240 |
| 2021 | $123 | $3,380 | $680 | $2,700 |
| 2020 | $123 | $3,380 | $680 | $2,700 |
| 2019 | $123 | $3,380 | $680 | $2,700 |
| 2018 | $123 | $3,380 | $0 | $0 |
| 2017 | $164 | $4,480 | $680 | $3,800 |
| 2014 | -- | $4,480 | $680 | $3,800 |
| 2013 | -- | $4,120 | $680 | $3,440 |
Source: Public Records
Map
Nearby Homes
- 1106 Grove St
- 418 Ross St
- 412 Ross St
- 964 Highland Ave
- 914 Highland Ave
- 700 Genetta Ct
- 602 S Hull St
- 440 S Highland Ct
- 704 S Capitol Pkwy
- 1700 Westhaven Ln
- 465 Finley Ave
- 459 Finley Ave
- 418 Burton Ave
- 1715 Haven Rd
- 1738 W 3rd St
- 488 Maury St
- 1807 W Third St
- 1255 S Hull St
- 1813 W Third St
- 2200 Boultier St