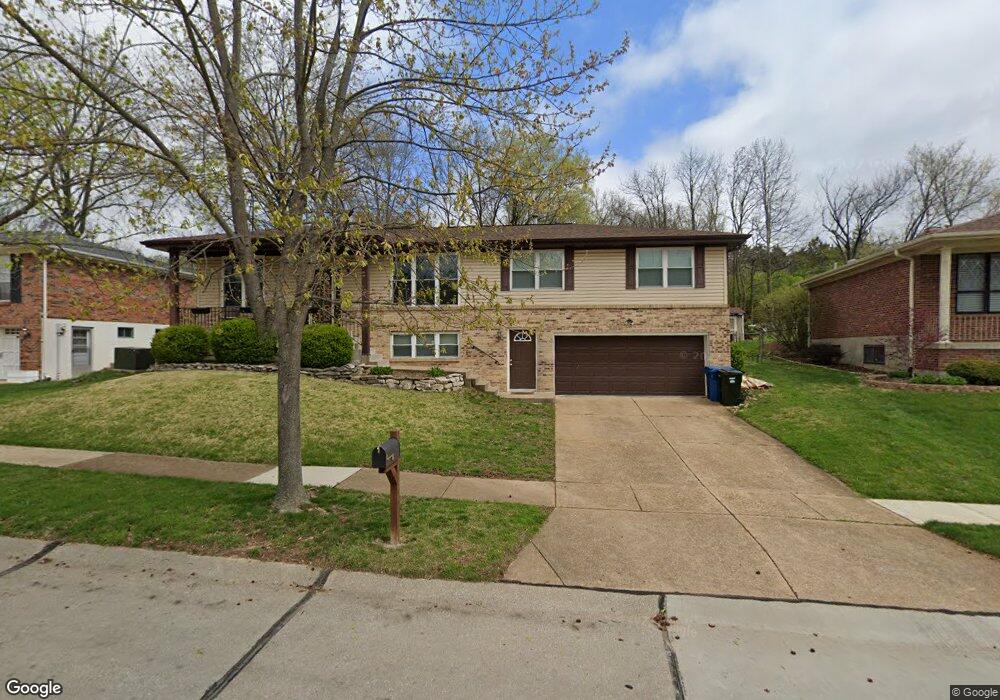
4841 Vermilion Dr Saint Louis, MO 63128
Estimated Value: $369,101 - $415,000
3
Beds
3
Baths
2,650
Sq Ft
$148/Sq Ft
Est. Value
About This Home
This home is located at 4841 Vermilion Dr, Saint Louis, MO 63128 and is currently estimated at $391,025, approximately $147 per square foot. 4841 Vermilion Dr is a home located in St. Louis County with nearby schools including Kennerly Elementary School, Sperreng Middle School, and Lindbergh High School.
Ownership History
Date
Name
Owned For
Owner Type
Purchase Details
Closed on
Apr 11, 2012
Sold by
Kwentus Peter and Kwentus Heidi
Bought by
Griswold Jeffrey and Griswold Emily
Current Estimated Value
Home Financials for this Owner
Home Financials are based on the most recent Mortgage that was taken out on this home.
Original Mortgage
$170,400
Outstanding Balance
$117,753
Interest Rate
3.92%
Mortgage Type
New Conventional
Estimated Equity
$273,272
Purchase Details
Closed on
Aug 10, 1999
Sold by
Braun Larry and Braun Mary M
Bought by
Kwentus Peter and Kwentus Heidi
Home Financials for this Owner
Home Financials are based on the most recent Mortgage that was taken out on this home.
Original Mortgage
$112,700
Interest Rate
7.71%
Create a Home Valuation Report for This Property
The Home Valuation Report is an in-depth analysis detailing your home's value as well as a comparison with similar homes in the area
Home Values in the Area
Average Home Value in this Area
Purchase History
| Date | Buyer | Sale Price | Title Company |
|---|---|---|---|
| Griswold Jeffrey | $213,000 | Investors Title Co Clayton | |
| Kwentus Peter | $140,900 | First American Title | |
| Cochran Mary Margaret | -- | First American Title |
Source: Public Records
Mortgage History
| Date | Status | Borrower | Loan Amount |
|---|---|---|---|
| Open | Griswold Jeffrey | $170,400 | |
| Previous Owner | Kwentus Peter | $112,700 |
Source: Public Records
Tax History Compared to Growth
Tax History
| Year | Tax Paid | Tax Assessment Tax Assessment Total Assessment is a certain percentage of the fair market value that is determined by local assessors to be the total taxable value of land and additions on the property. | Land | Improvement |
|---|---|---|---|---|
| 2025 | $3,839 | $66,690 | $15,390 | $51,300 |
| 2024 | $3,839 | $59,010 | $17,100 | $41,910 |
| 2023 | $3,839 | $59,010 | $17,100 | $41,910 |
| 2022 | $3,510 | $51,870 | $17,100 | $34,770 |
| 2021 | $3,386 | $51,870 | $17,100 | $34,770 |
| 2020 | $3,083 | $45,540 | $15,390 | $30,150 |
| 2019 | $3,075 | $45,540 | $15,390 | $30,150 |
| 2018 | $2,821 | $37,970 | $9,410 | $28,560 |
| 2017 | $2,791 | $37,970 | $9,410 | $28,560 |
| 2016 | $2,765 | $35,720 | $8,550 | $27,170 |
| 2015 | $2,664 | $34,940 | $8,550 | $26,390 |
| 2014 | $2,651 | $34,430 | $4,960 | $29,470 |
Source: Public Records
Map
Nearby Homes
- 4829 Vermilion Dr
- 4449 Pinyon Jay Ct
- 4818 Chapel Hill Dr
- 4931 Theiss Rd
- 4700 Theiss Rd
- 4643 Littlebury Dr
- 4642 Theiss Rd
- 4849 Gatesbury Dr
- 4838 Dorsie Dr
- 4740 Hedgemont Dr
- 4501 Eli Dr Unit I
- 4525 Eli Dr Unit D
- 4645 Tauneybrook Dr
- 12055 Charwick Dr
- 25 Fawnwood Dr
- 11862 E Concord Rd
- 12015 Charwick Dr
- 4833 Hursley Dr
- 4839 Hursley Dr
- 4334 Arrow Tree Dr Unit L
- 4847 Vermilion Dr
- 4835 Vermilion Dr
- 4832 Vermilion Dr
- 4838 Vermilion Dr
- 4851 Vermilion Dr
- 4472 Pinyon Jay Ct
- 4826 Vermilion Dr
- 4844 Vermilion Dr
- 4466 Pinyon Jay Ct
- 4823 Vermilion Dr
- 4850 Vermilion Dr
- 4820 Vermilion Dr
- 4799 Kingbird Ln
- 4817 Vermilion Dr
- 4857 Vermilion Dr
- 4796 Kingbird Ln
- 4856 Vermilion Dr
- 4814 Vermilion Dr
- 4477 Pinyon Jay Ct
- 4473 Pinyon Jay Ct