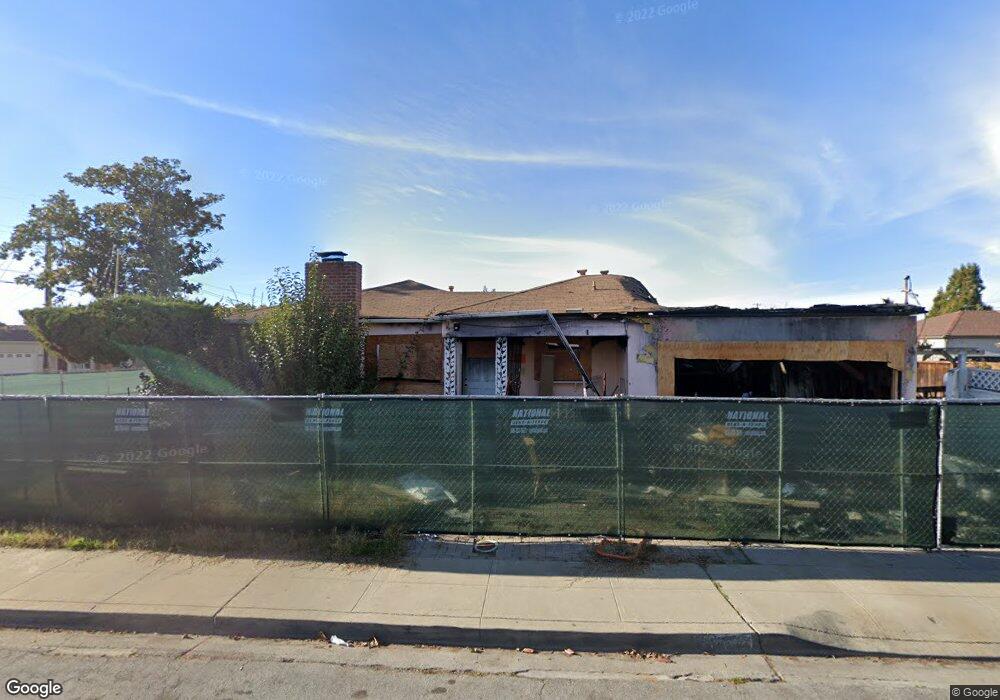
4845 Driftwood Dr Fremont, CA 94536
Centerville District NeighborhoodEstimated Value: $939,000 - $1,229,000
3
Beds
2
Baths
1,087
Sq Ft
$981/Sq Ft
Est. Value
About This Home
This home is located at 4845 Driftwood Dr, Fremont, CA 94536 and is currently estimated at $1,066,868, approximately $981 per square foot. 4845 Driftwood Dr is a home located in Alameda County with nearby schools including Glenmoor Elementary School, Centerville Junior High School, and Washington High School.
Ownership History
Date
Name
Owned For
Owner Type
Purchase Details
Closed on
Jun 26, 2008
Sold by
Buenaflor David
Bought by
Freitas Frank and Freitas Linda M
Current Estimated Value
Purchase Details
Closed on
Sep 24, 2004
Sold by
Buenaflor Janet
Bought by
Buenaflor David
Home Financials for this Owner
Home Financials are based on the most recent Mortgage that was taken out on this home.
Original Mortgage
$440,000
Interest Rate
6.41%
Mortgage Type
Stand Alone First
Purchase Details
Closed on
Jan 8, 2003
Sold by
Lewis Kathleen and King Kathleen
Bought by
Lewis Timothy A and Lewis Kathleen
Home Financials for this Owner
Home Financials are based on the most recent Mortgage that was taken out on this home.
Original Mortgage
$100,000
Interest Rate
6.15%
Mortgage Type
Credit Line Revolving
Create a Home Valuation Report for This Property
The Home Valuation Report is an in-depth analysis detailing your home's value as well as a comparison with similar homes in the area
Home Values in the Area
Average Home Value in this Area
Purchase History
| Date | Buyer | Sale Price | Title Company |
|---|---|---|---|
| Freitas Frank | $430,000 | Commonwealth Land Title | |
| Buenaflor David | -- | Chicago Title Company | |
| Buenaflor David | $550,000 | Chicago Title Company | |
| Lewis Timothy A | -- | Fidelity National Title Co |
Source: Public Records
Mortgage History
| Date | Status | Borrower | Loan Amount |
|---|---|---|---|
| Previous Owner | Buenaflor David | $440,000 | |
| Previous Owner | Lewis Timothy A | $100,000 | |
| Closed | Buenaflor David | $110,000 |
Source: Public Records
Tax History Compared to Growth
Tax History
| Year | Tax Paid | Tax Assessment Tax Assessment Total Assessment is a certain percentage of the fair market value that is determined by local assessors to be the total taxable value of land and additions on the property. | Land | Improvement |
|---|---|---|---|---|
| 2025 | $1,961 | $166,109 | $166,109 | -- |
| 2024 | $1,961 | $162,853 | $162,853 | -- |
| 2023 | $1,916 | $159,660 | $159,660 | $0 |
| 2022 | $6,679 | $521,770 | $156,531 | $365,239 |
| 2021 | $6,519 | $511,540 | $153,462 | $358,078 |
| 2020 | $6,501 | $506,298 | $151,889 | $354,409 |
| 2019 | $6,430 | $496,374 | $148,912 | $347,462 |
| 2018 | $6,304 | $486,643 | $145,993 | $340,650 |
| 2017 | $6,147 | $477,101 | $143,130 | $333,971 |
| 2016 | $6,038 | $467,748 | $140,324 | $327,424 |
| 2015 | $5,953 | $460,727 | $138,218 | $322,509 |
| 2014 | $5,848 | $451,705 | $135,511 | $316,194 |
Source: Public Records
Map
Nearby Homes
- 4737 Deadwood Dr
- 37721 Madera Ct
- 37114 Dondero Way
- 4586 Norris Rd
- 4637 Rothbury Common
- 37792 Colfax Ct
- 37987 Alta Dr
- 5169 Lawler Ave
- 5268 Keeler Ct
- 37001 Contra Costa Ave
- 38324 Blacow Rd
- 4632 Balboa Way
- 4715 Eggers Dr
- 37659 Granville Dr
- 36720 Charles St
- 36686 Charles St
- 36521 Cabrillo Dr
- 5113 Dupont Ave
- 4754 Northdale Dr
- Plan 1629 at Veranda
- 4827 Driftwood Dr
- 37489 Briarwood Dr
- 37480 Southwood Dr
- 37518 Southwood Dr
- 4836 Driftwood Dr
- 37493 Southwood Dr
- 37481 Briarwood Dr
- 37507 Southwood Dr
- 37485 Southwood Dr
- 4824 Driftwood Dr
- 37472 Southwood Dr
- 37515 Southwood Dr
- 37477 Southwood Dr
- 37473 Briarwood Dr
- 37526 Southwood Dr
- 4812 Driftwood Dr
- 4827 Central Ave
- 37523 Southwood Dr
- 4789 Driftwood Dr
- 37486 Briarwood Dr