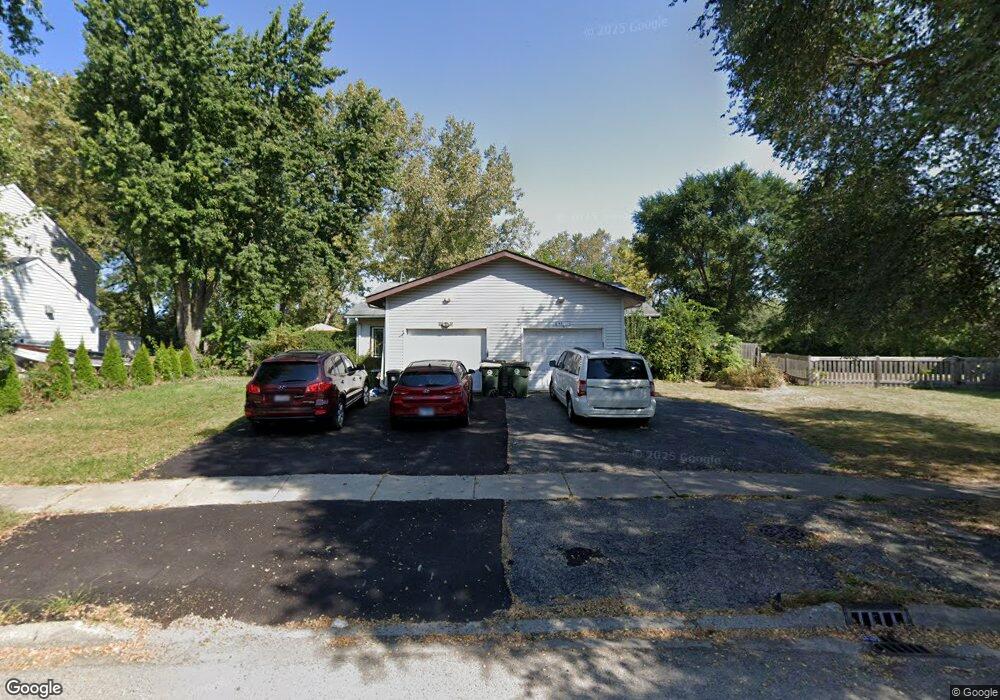
485 Johelia Trail Antioch, IL 60002
North Park NeighborhoodEstimated Value: $159,000 - $301,425
2
Beds
2
Baths
1,297
Sq Ft
$186/Sq Ft
Est. Value
About This Home
This home is located at 485 Johelia Trail, Antioch, IL 60002 and is currently estimated at $241,856, approximately $186 per square foot. 485 Johelia Trail is a home located in Lake County with nearby schools including Antioch Community High School.
Ownership History
Date
Name
Owned For
Owner Type
Purchase Details
Closed on
Dec 17, 2018
Sold by
Dunlap Laurence M and Dunlap Joan H
Bought by
Wilkinson Austin
Current Estimated Value
Purchase Details
Closed on
May 18, 2005
Sold by
Green Harold and Green Renate
Bought by
Dunlap Laurence M and Dunlap Joan H
Home Financials for this Owner
Home Financials are based on the most recent Mortgage that was taken out on this home.
Original Mortgage
$132,000
Interest Rate
5.37%
Mortgage Type
Unknown
Purchase Details
Closed on
Mar 19, 1997
Sold by
Firstar Bank Illinois
Bought by
Green Harold and Green Renate
Purchase Details
Closed on
May 24, 1996
Sold by
Bank Of Waukegan
Bought by
Emerson Michael J and Emerson Kimberly S
Home Financials for this Owner
Home Financials are based on the most recent Mortgage that was taken out on this home.
Original Mortgage
$118,763
Interest Rate
7.97%
Mortgage Type
FHA
Create a Home Valuation Report for This Property
The Home Valuation Report is an in-depth analysis detailing your home's value as well as a comparison with similar homes in the area
Home Values in the Area
Average Home Value in this Area
Purchase History
| Date | Buyer | Sale Price | Title Company |
|---|---|---|---|
| Wilkinson Austin | $134,500 | Gmt Title Agency | |
| Dunlap Laurence M | $165,000 | -- | |
| Green Harold | $113,500 | -- | |
| Emerson Michael J | $120,000 | -- |
Source: Public Records
Mortgage History
| Date | Status | Borrower | Loan Amount |
|---|---|---|---|
| Previous Owner | Dunlap Laurence M | $132,000 | |
| Previous Owner | Emerson Michael J | $118,763 |
Source: Public Records
Tax History Compared to Growth
Tax History
| Year | Tax Paid | Tax Assessment Tax Assessment Total Assessment is a certain percentage of the fair market value that is determined by local assessors to be the total taxable value of land and additions on the property. | Land | Improvement |
|---|---|---|---|---|
| 2024 | $5,483 | $64,567 | $4,662 | $59,905 |
| 2023 | $5,483 | $57,814 | $4,174 | $53,640 |
| 2022 | $4,838 | $49,075 | $4,226 | $44,849 |
| 2021 | $4,463 | $45,791 | $3,943 | $41,848 |
| 2020 | $4,362 | $44,526 | $3,834 | $40,692 |
| 2019 | $4,413 | $42,580 | $3,666 | $38,914 |
| 2018 | $3,919 | $44,359 | $3,723 | $40,636 |
| 2017 | $3,857 | $42,223 | $3,544 | $38,679 |
| 2016 | $3,595 | $40,748 | $3,420 | $37,328 |
| 2015 | $3,611 | $39,712 | $3,333 | $36,379 |
| 2014 | $3,708 | $41,513 | $7,201 | $34,312 |
| 2012 | $3,398 | $41,513 | $7,201 | $34,312 |
Source: Public Records
Map
Nearby Homes
- 570 Collier Dr
- 603 Ridgewood Dr
- 558 1st St
- 582 Phillips Cir
- 394 Birchwood Dr
- 336 Hawthorn Ln
- 602 Anita Ave
- 801 Main St
- 12719 234th Ave
- 735 Creek Bend Ln
- 770 Anita Ave
- 811 Tiffany Farms Rd
- 23607 125th St
- 188 Oakwood Dr
- 900 Elizabeth St
- 324 Elmwood Ln
- 672 Garys Dr
- 73 W Old Mill Trail
- 198 Bridgewood Dr
- 23624 124th St
- 483 Johelia Trail
- 491 Johelia Trail
- 481 Johelia Trail
- 479 Johelia Trail
- 477 Johelia Trail
- 472 Joren Trail
- 475 Johelia Trail
- 474 Joren Trail
- 470 Joren Trail
- 476 Joren Trail
- 473 Johelia Trail
- 478 Joren Trail
- 466 Joren Trail
- 486 Donin Dr
- 490 Donin Dr
- 488 Donin Dr
- 431 North Ave
- 471 Johelia Trail
- 464 Joren Trail
- 469 North Ave