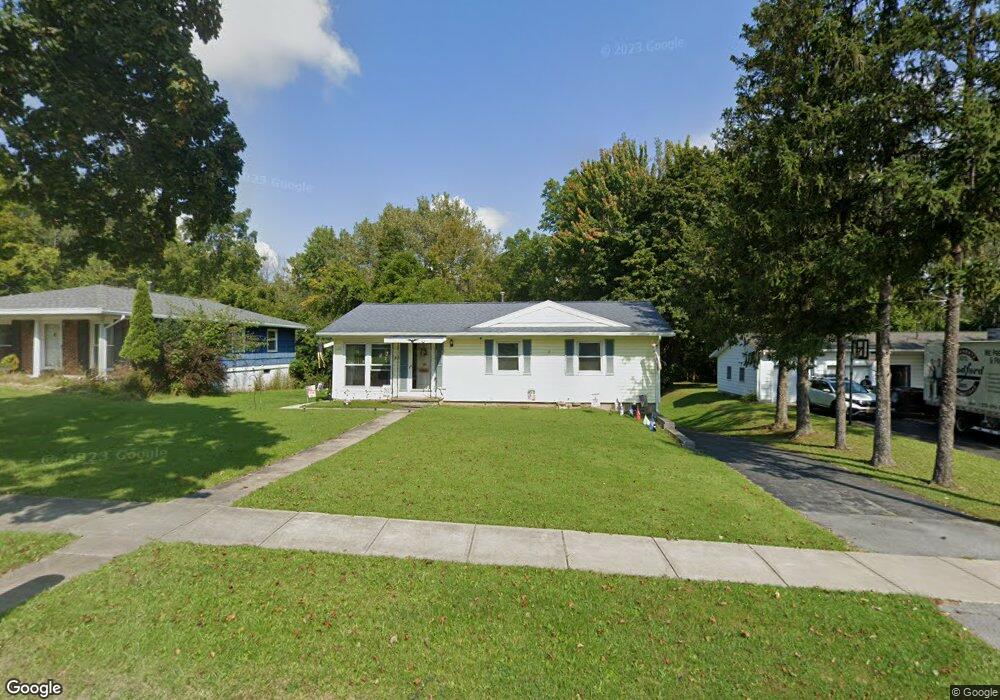
49 Clymer St Auburn, NY 13021
Estimated Value: $204,604 - $226,000
3
Beds
2
Baths
1,264
Sq Ft
$171/Sq Ft
Est. Value
About This Home
This home is located at 49 Clymer St, Auburn, NY 13021 and is currently estimated at $216,651, approximately $171 per square foot. 49 Clymer St is a home located in Cayuga County with nearby schools including Auburn Junior High School, Auburn High School, and Creative Minds Montessori School.
Ownership History
Date
Name
Owned For
Owner Type
Purchase Details
Closed on
Aug 11, 2022
Sold by
Gillette Shelley A
Bought by
Gillette Timothy J and Gillette Shelley A
Current Estimated Value
Purchase Details
Closed on
Sep 4, 2013
Sold by
Hora Michael J O and Hora Shelley A O
Bought by
Hora Shelley A O
Purchase Details
Closed on
Jan 16, 2001
Sold by
O'Hora Michael J
Bought by
O'Hora Michael
Purchase Details
Closed on
Jan 13, 2000
Sold by
Edwards George R
Bought by
O'Hora Michael
Create a Home Valuation Report for This Property
The Home Valuation Report is an in-depth analysis detailing your home's value as well as a comparison with similar homes in the area
Home Values in the Area
Average Home Value in this Area
Purchase History
| Date | Buyer | Sale Price | Title Company |
|---|---|---|---|
| Gillette Timothy J | $41,250 | None Listed On Document | |
| Hora Shelley A O | -- | None Available | |
| O'Hora Michael | -- | None | |
| O'Hora Michael | $64,000 | Samuel Sanford |
Source: Public Records
Tax History Compared to Growth
Tax History
| Year | Tax Paid | Tax Assessment Tax Assessment Total Assessment is a certain percentage of the fair market value that is determined by local assessors to be the total taxable value of land and additions on the property. | Land | Improvement |
|---|---|---|---|---|
| 2024 | $3,348 | $143,600 | $22,100 | $121,500 |
| 2023 | $3,344 | $143,600 | $22,100 | $121,500 |
| 2022 | $2,961 | $143,600 | $22,100 | $121,500 |
| 2021 | $2,971 | $128,700 | $18,500 | $110,200 |
| 2020 | $2,928 | $128,700 | $18,500 | $110,200 |
| 2019 | $1,094 | $128,700 | $18,500 | $110,200 |
| 2018 | $2,822 | $128,700 | $18,500 | $110,200 |
| 2017 | $2,805 | $122,800 | $19,800 | $103,000 |
| 2016 | $3,336 | $122,800 | $19,800 | $103,000 |
| 2015 | $1,539 | $122,800 | $19,800 | $103,000 |
| 2014 | $1,539 | $122,800 | $19,800 | $103,000 |
Source: Public Records
Map
Nearby Homes