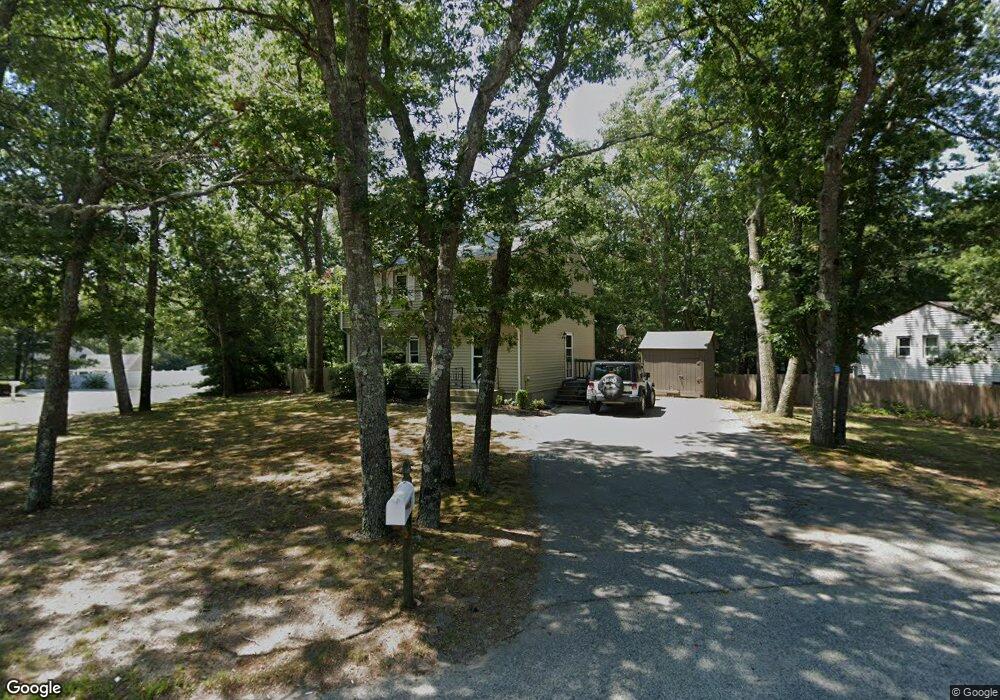
49 Montgomery Dr Plymouth, MA 02360
Estimated Value: $570,000 - $623,000
4
Beds
2
Baths
1,501
Sq Ft
$403/Sq Ft
Est. Value
About This Home
This home is located at 49 Montgomery Dr, Plymouth, MA 02360 and is currently estimated at $605,099, approximately $403 per square foot. 49 Montgomery Dr is a home located in Plymouth County with nearby schools including West Elementary School, Plymouth Community Intermediate, and Plymouth North High School.
Ownership History
Date
Name
Owned For
Owner Type
Purchase Details
Closed on
Jun 30, 2004
Sold by
Riordan John A and Riordan Tracy L
Bought by
Horgan John J and Horgan Susan L
Current Estimated Value
Purchase Details
Closed on
Mar 21, 1997
Sold by
Martinelli Jean
Bought by
Riordan John A and Riordan Tracy L
Purchase Details
Closed on
Dec 16, 1996
Sold by
Bankers Trust Co Ca
Bought by
Martinelli Jean
Purchase Details
Closed on
Dec 28, 1995
Sold by
Bankers Trust Co Of Ca and Paquette Robert G
Bought by
Bankers Trust Co Of Ca
Purchase Details
Closed on
Apr 27, 1993
Sold by
Usa Va
Bought by
Paquette Robert G
Purchase Details
Closed on
Sep 11, 1992
Sold by
Allington Michael F and Allington Elizabeth
Bought by
Secy Of Veterans Affrs
Purchase Details
Closed on
Aug 2, 1989
Sold by
Pike Charles G
Bought by
Allington Michael F
Create a Home Valuation Report for This Property
The Home Valuation Report is an in-depth analysis detailing your home's value as well as a comparison with similar homes in the area
Home Values in the Area
Average Home Value in this Area
Purchase History
| Date | Buyer | Sale Price | Title Company |
|---|---|---|---|
| Horgan John J | $330,000 | -- | |
| Riordan John A | $125,000 | -- | |
| Riordan John A | $125,000 | -- | |
| Martinelli Jean | $66,500 | -- | |
| Martinelli Jean | $66,500 | -- | |
| Bankers Trust Co Of Ca | $79,121 | -- | |
| Bankers Trust Co Of Ca | $79,121 | -- | |
| Paquette Robert G | $120,734 | -- | |
| Paquette Robert G | $120,734 | -- | |
| Secy Of Veterans Affrs | $108,653 | -- | |
| Secy Of Veterans Affrs | $108,653 | -- | |
| Allington Michael F | $134,500 | -- | |
| Allington Michael F | $134,500 | -- |
Source: Public Records
Mortgage History
| Date | Status | Borrower | Loan Amount |
|---|---|---|---|
| Previous Owner | Allington Michael F | $130,000 | |
| Previous Owner | Allington Michael F | $14,000 |
Source: Public Records
Tax History Compared to Growth
Tax History
| Year | Tax Paid | Tax Assessment Tax Assessment Total Assessment is a certain percentage of the fair market value that is determined by local assessors to be the total taxable value of land and additions on the property. | Land | Improvement |
|---|---|---|---|---|
| 2025 | $6,186 | $487,500 | $260,800 | $226,700 |
| 2024 | $6,081 | $472,500 | $247,600 | $224,900 |
| 2023 | $5,891 | $429,700 | $225,600 | $204,100 |
| 2022 | $5,708 | $369,900 | $203,600 | $166,300 |
| 2021 | $5,614 | $347,400 | $203,600 | $143,800 |
| 2020 | $5,461 | $334,000 | $192,600 | $141,400 |
| 2019 | $5,141 | $310,800 | $170,600 | $140,200 |
| 2018 | $4,938 | $300,000 | $159,600 | $140,400 |
| 2017 | $4,757 | $286,900 | $159,600 | $127,300 |
| 2016 | $4,469 | $274,700 | $147,100 | $127,600 |
| 2015 | $4,190 | $269,600 | $141,800 | $127,800 |
| 2014 | $3,975 | $262,700 | $141,800 | $120,900 |
Source: Public Records
Map
Nearby Homes
- 16 Filmore St
- 7 Sansome St
- 37 Flintlocke Dr
- 25 Harvard Dr
- 166 Carver Rd
- 2 Candlelight Dr
- 16 Matthews Trail
- 19 Coachman Terrace
- 6 Stone Gate Dr
- 17 Lydia Dr
- 62 Jan Marie Dr
- 6 Deer Hill Ln
- 52 W Pond Rd
- 9 Lawrence Rd
- 50 Pinehurst Dr
- 55 Pinehurst Dr
- 49 Snowgoose Ln
- 235 Carver Rd Unit 7
- 85 Narragansett Dr
- 3 Howard Dr