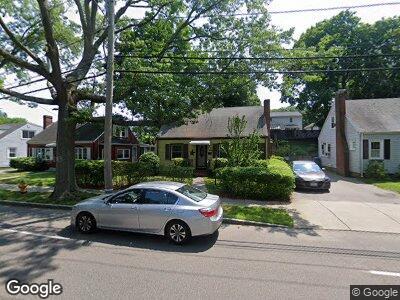
49 Rice Rd Quincy, MA 02170
Wollaston NeighborhoodEstimated Value: $602,000 - $720,000
3
Beds
1
Bath
1,080
Sq Ft
$606/Sq Ft
Est. Value
About This Home
This home is located at 49 Rice Rd, Quincy, MA 02170 and is currently estimated at $654,405, approximately $605 per square foot. 49 Rice Rd is a home located in Norfolk County with nearby schools including Beechwood Knoll Elementary School, Central Middle School, and North Quincy High School.
Ownership History
Date
Name
Owned For
Owner Type
Purchase Details
Closed on
Jun 27, 1995
Sold by
Rice Rd Rt
Bought by
Johnston Peter R and Johnston Barbara E
Current Estimated Value
Create a Home Valuation Report for This Property
The Home Valuation Report is an in-depth analysis detailing your home's value as well as a comparison with similar homes in the area
Home Values in the Area
Average Home Value in this Area
Purchase History
| Date | Buyer | Sale Price | Title Company |
|---|---|---|---|
| Johnston Peter R | $123,000 | -- |
Source: Public Records
Mortgage History
| Date | Status | Borrower | Loan Amount |
|---|---|---|---|
| Open | Johnston Peter R | $250,000 | |
| Closed | Johnston Peter R | $127,300 | |
| Closed | Johnston Peter R | $60,000 | |
| Closed | Johnston Peter R | $270,500 | |
| Closed | Johnston Peter R | $283,000 | |
| Closed | Johnston Barbara E | $100,000 | |
| Closed | Johnston Peter R | $145,000 | |
| Closed | Johnston Peter R | $30,000 |
Source: Public Records
Tax History Compared to Growth
Tax History
| Year | Tax Paid | Tax Assessment Tax Assessment Total Assessment is a certain percentage of the fair market value that is determined by local assessors to be the total taxable value of land and additions on the property. | Land | Improvement |
|---|---|---|---|---|
| 2025 | $6,082 | $527,500 | $316,200 | $211,300 |
| 2024 | $5,942 | $527,200 | $316,200 | $211,000 |
| 2023 | $5,546 | $498,300 | $301,100 | $197,200 |
| 2022 | $5,090 | $424,900 | $240,900 | $184,000 |
| 2021 | $5,093 | $419,500 | $240,900 | $178,600 |
| 2020 | $5,065 | $407,500 | $240,900 | $166,600 |
| 2019 | $4,667 | $371,900 | $225,100 | $146,800 |
| 2018 | $4,701 | $352,400 | $204,700 | $147,700 |
| 2017 | $4,673 | $329,800 | $204,700 | $125,100 |
| 2016 | $4,311 | $300,200 | $186,100 | $114,100 |
| 2015 | $4,000 | $274,000 | $169,200 | $104,800 |
| 2014 | $3,721 | $250,400 | $161,100 | $89,300 |
Source: Public Records
Map
Nearby Homes
- 11 Andrews Rd
- 32 Patten St
- 54 Thornton St
- 45 Franklin Ave
- 857 Quincy Shore Dr
- 102 Sachem St
- 57 Florence St
- 131 Greene St
- 176 W Elm Ave
- 208 Beach St
- 80 Willet St
- 163 Clay St Unit 3
- 163 Clay St Unit 2
- 163 Clay St Unit 1
- 54 Channing St
- 32 Channing St
- 123 Clay St
- 49 Rawson Rd
- 522 Hancock St
- 50-52 Flynt St