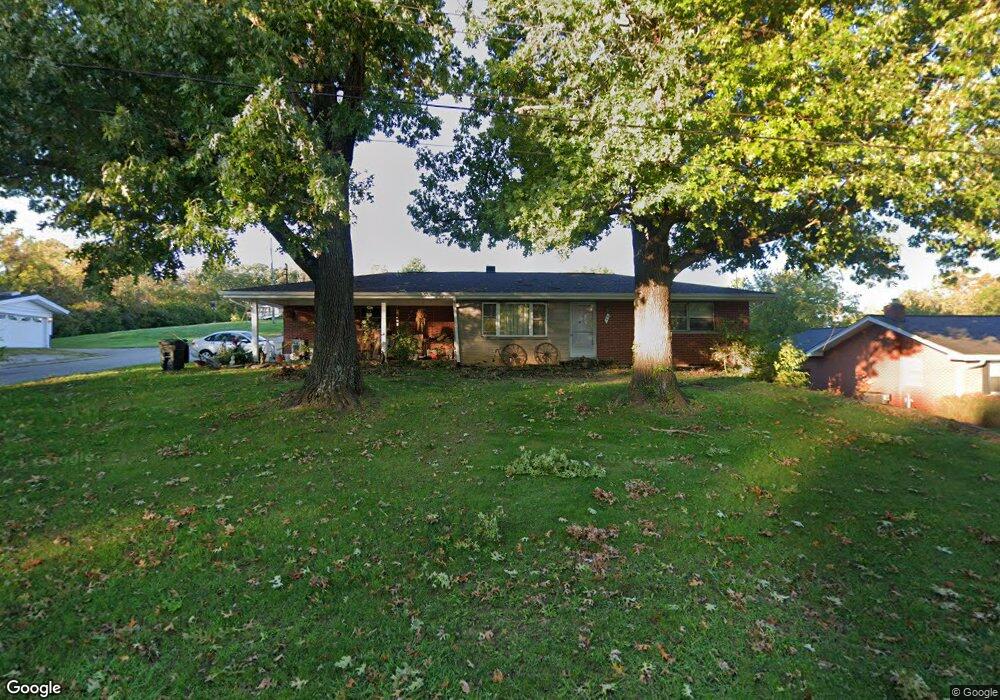
49 Viewpoint Dr Alexandria, KY 41001
Estimated Value: $197,000 - $248,000
2
Beds
1
Bath
999
Sq Ft
$217/Sq Ft
Est. Value
About This Home
This home is located at 49 Viewpoint Dr, Alexandria, KY 41001 and is currently estimated at $216,723, approximately $216 per square foot. 49 Viewpoint Dr is a home located in Campbell County with nearby schools including Donald E. Cline Elementary School, Campbell County Middle School, and Campbell County High School.
Ownership History
Date
Name
Owned For
Owner Type
Purchase Details
Closed on
Nov 7, 2022
Sold by
Redman William Robert and Redman Deborah Jean
Bought by
Redman Jessica Lee
Current Estimated Value
Purchase Details
Closed on
Apr 12, 2018
Sold by
Betty Lou Redman Estate
Bought by
Redman Willam
Purchase Details
Closed on
Mar 7, 2000
Sold by
Goforth Alan J
Bought by
Redman Betty L
Home Financials for this Owner
Home Financials are based on the most recent Mortgage that was taken out on this home.
Original Mortgage
$63,000
Interest Rate
7.88%
Mortgage Type
New Conventional
Purchase Details
Closed on
May 2, 1996
Sold by
Griffith Charles E
Bought by
Goforth Alan J and Goforth Robin A
Home Financials for this Owner
Home Financials are based on the most recent Mortgage that was taken out on this home.
Original Mortgage
$50,000
Interest Rate
7.77%
Mortgage Type
Balloon
Create a Home Valuation Report for This Property
The Home Valuation Report is an in-depth analysis detailing your home's value as well as a comparison with similar homes in the area
Home Values in the Area
Average Home Value in this Area
Purchase History
| Date | Buyer | Sale Price | Title Company |
|---|---|---|---|
| Redman Jessica Lee | -- | None Listed On Document | |
| Redman Willam | $93,000 | None Available | |
| Redman Betty L | $93,000 | -- | |
| Goforth Alan J | $82,000 | -- |
Source: Public Records
Mortgage History
| Date | Status | Borrower | Loan Amount |
|---|---|---|---|
| Previous Owner | Redman Betty L | $63,000 | |
| Previous Owner | Goforth Alan J | $50,000 |
Source: Public Records
Tax History Compared to Growth
Tax History
| Year | Tax Paid | Tax Assessment Tax Assessment Total Assessment is a certain percentage of the fair market value that is determined by local assessors to be the total taxable value of land and additions on the property. | Land | Improvement |
|---|---|---|---|---|
| 2024 | $1,992 | $164,900 | $35,000 | $129,900 |
| 2023 | $1,946 | $164,900 | $35,000 | $129,900 |
| 2022 | $1,003 | $117,900 | $20,000 | $97,900 |
| 2021 | $1,014 | $117,900 | $20,000 | $97,900 |
| 2020 | $1,043 | $117,900 | $20,000 | $97,900 |
| 2019 | $1,516 | $117,900 | $20,000 | $97,900 |
| 2018 | $1,475 | $113,800 | $15,900 | $97,900 |
| 2017 | $1,459 | $113,800 | $15,900 | $97,900 |
| 2016 | $1,395 | $113,800 | $0 | $0 |
| 2015 | $1,427 | $113,800 | $0 | $0 |
| 2014 | $1,377 | $113,800 | $0 | $0 |
Source: Public Records
Map
Nearby Homes
- 656 Streamside Lower Dr
- 714 Streamside Dr Unit L
- 500 Inverness Way
- 762 Yorkshire Dr
- 7446 Cheshire Ct
- 792 Yorkshire Dr
- 7483 Flintshire Dr
- 7523 Devonshire Dr
- 7797 Promontory Dr
- 7781 Arcadia Blvd
- 12 Enzweiler Rd
- 7623 Alexandria Pike
- Waverly II Plan at Riffle Ridge
- 7864 Arcadia Blvd
- 0 Aa-Hwy & Rocky View Unit 553765
- 7920 Arcadia Blvd
- 6903 E Alexandria Pike
- 7912 Alexandria Pike
- 7268 Licking Pike
- 6614 Heck Rd
- 53 Viewpoint Dr
- 57 Viewpoint Dr
- 11 Oak View Dr
- 46 Viewpoint Dr
- 50 Viewpoint Dr
- 61 Viewpoint Dr
- 10 Oak View Dr
- 58 Viewpoint Dr
- 2 Oak View Dr
- 40 Viewpoint Dr
- 2 Oak View Dr
- 39 Viewpoint Dr
- 65 Viewpoint Dr
- 34 Viewpoint Dr
- 78 Viewpoint Dr
- 69 Viewpoint Dr
- 35 Viewpoint Dr
- 82 Viewpoint Dr
- 73 Viewpoint Dr
- 30 Viewpoint Dr