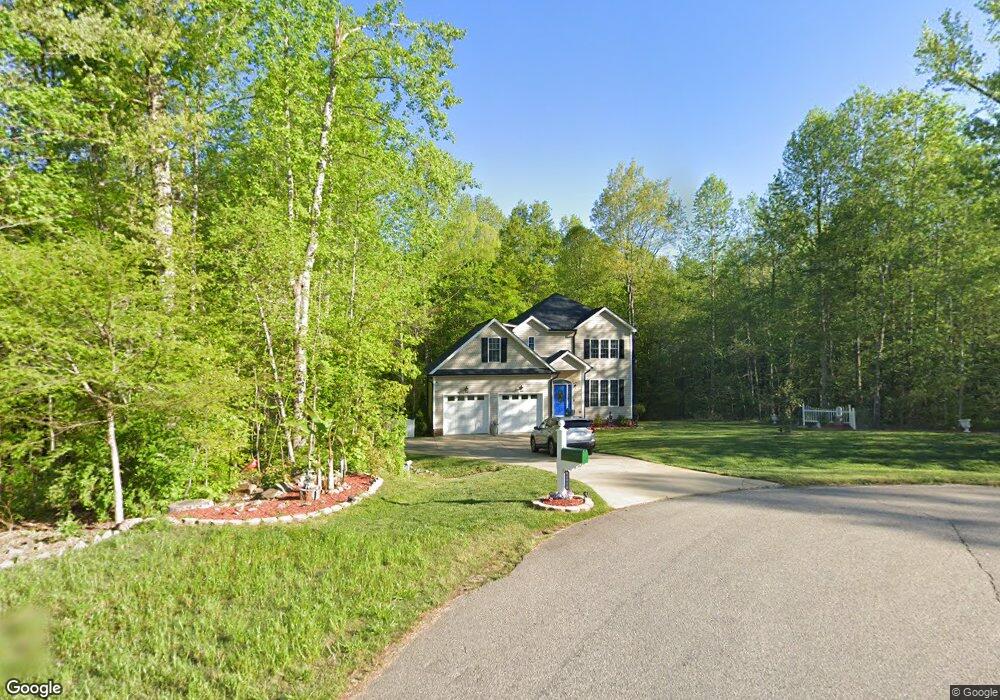
4900 Radish Hill Ct Garner, NC 27529
Estimated Value: $415,283 - $435,000
3
Beds
3
Baths
1,896
Sq Ft
$223/Sq Ft
Est. Value
About This Home
This home is located at 4900 Radish Hill Ct, Garner, NC 27529 and is currently estimated at $422,321, approximately $222 per square foot. 4900 Radish Hill Ct is a home located in Wake County with nearby schools including Aversboro Elementary, East Garner Middle School, and South Garner High.
Ownership History
Date
Name
Owned For
Owner Type
Purchase Details
Closed on
Jun 9, 2020
Sold by
Johnson Matthew D and Johnson Jillian H
Bought by
Rivera Marisol and Rivera Jose O
Current Estimated Value
Home Financials for this Owner
Home Financials are based on the most recent Mortgage that was taken out on this home.
Original Mortgage
$130,000
Outstanding Balance
$115,235
Interest Rate
3.2%
Mortgage Type
New Conventional
Estimated Equity
$307,086
Purchase Details
Closed on
Apr 17, 2017
Sold by
Welch Joseph J and Welch Jamie L
Bought by
Johnson Matthew D and Johnson Jillian H
Home Financials for this Owner
Home Financials are based on the most recent Mortgage that was taken out on this home.
Original Mortgage
$215,000
Interest Rate
4.1%
Mortgage Type
VA
Purchase Details
Closed on
Nov 30, 2005
Sold by
Stafford Land Co Inc
Bought by
Welch Joseph J and Welch Kim M
Home Financials for this Owner
Home Financials are based on the most recent Mortgage that was taken out on this home.
Original Mortgage
$197,100
Interest Rate
6%
Mortgage Type
Construction
Create a Home Valuation Report for This Property
The Home Valuation Report is an in-depth analysis detailing your home's value as well as a comparison with similar homes in the area
Home Values in the Area
Average Home Value in this Area
Purchase History
| Date | Buyer | Sale Price | Title Company |
|---|---|---|---|
| Rivera Marisol | $255,000 | None Available | |
| Johnson Matthew D | $215,000 | None Available | |
| Welch Joseph J | $41,500 | None Available |
Source: Public Records
Mortgage History
| Date | Status | Borrower | Loan Amount |
|---|---|---|---|
| Open | Rivera Marisol | $130,000 | |
| Previous Owner | Johnson Matthew D | $215,000 | |
| Previous Owner | Welch Joseph J | $197,100 |
Source: Public Records
Tax History Compared to Growth
Tax History
| Year | Tax Paid | Tax Assessment Tax Assessment Total Assessment is a certain percentage of the fair market value that is determined by local assessors to be the total taxable value of land and additions on the property. | Land | Improvement |
|---|---|---|---|---|
| 2025 | $2,525 | $391,592 | $90,000 | $301,592 |
| 2024 | $2,452 | $391,592 | $90,000 | $301,592 |
| 2023 | $1,850 | $234,699 | $42,000 | $192,699 |
| 2022 | $1,715 | $234,699 | $42,000 | $192,699 |
| 2021 | $1,669 | $234,699 | $42,000 | $192,699 |
| 2020 | $1,642 | $234,699 | $42,000 | $192,699 |
| 2019 | $1,635 | $197,731 | $35,000 | $162,731 |
| 2018 | $1,504 | $197,731 | $35,000 | $162,731 |
| 2017 | $1,426 | $197,731 | $35,000 | $162,731 |
| 2016 | $1,397 | $197,731 | $35,000 | $162,731 |
| 2015 | $1,530 | $217,438 | $40,000 | $177,438 |
| 2014 | $1,451 | $217,438 | $40,000 | $177,438 |
Source: Public Records
Map
Nearby Homes
- 1004 Cabin Hill Way
- 107 Bull Bay Ln
- 139 Bull Bay Ln
- 135 Bull Bay Ln
- 221 Sprenger St
- 229 Sprenger St
- 233 Sprenger St
- 928 Grand Mesa Dr
- 932 Grand Mesa Dr
- 936 Grand Mesa Dr
- 151 Sprenger St
- 940 Grand Mesa Dr
- 147 Sprenger St
- 143 Sprenger St
- 944 Grand Mesa Dr
- 948 Grand Mesa Dr
- 905 Grand Mesa Dr
- 909 Grand Mesa Dr
- 172 Sprenger St
- 184 Sprenger St
- 4905 Radish Hill Ct
- 4904 Radish Hill Ct
- 4909 Radish Hill Ct
- 4933 Wyandot Ln
- 4908 Radish Hill Ct
- 4932 Wyandot Ln
- 4929 Wyandot Ln
- 4928 Wyandot Ln
- 1321 Red Brick Rd
- 4924 Wyandot Ln
- 4921 Wyandot Ln
- 4920 Wyandot Ln
- 4916 Wyandot Ln
- 1313 Red Brick Rd
- 4917 Wyandot Ln
- 1104 Onandaga Dr
- 1324 Red Brick Rd
- 1108 Onandaga Dr
- 1112 Onandaga Dr
- 4912 Seminole Ln