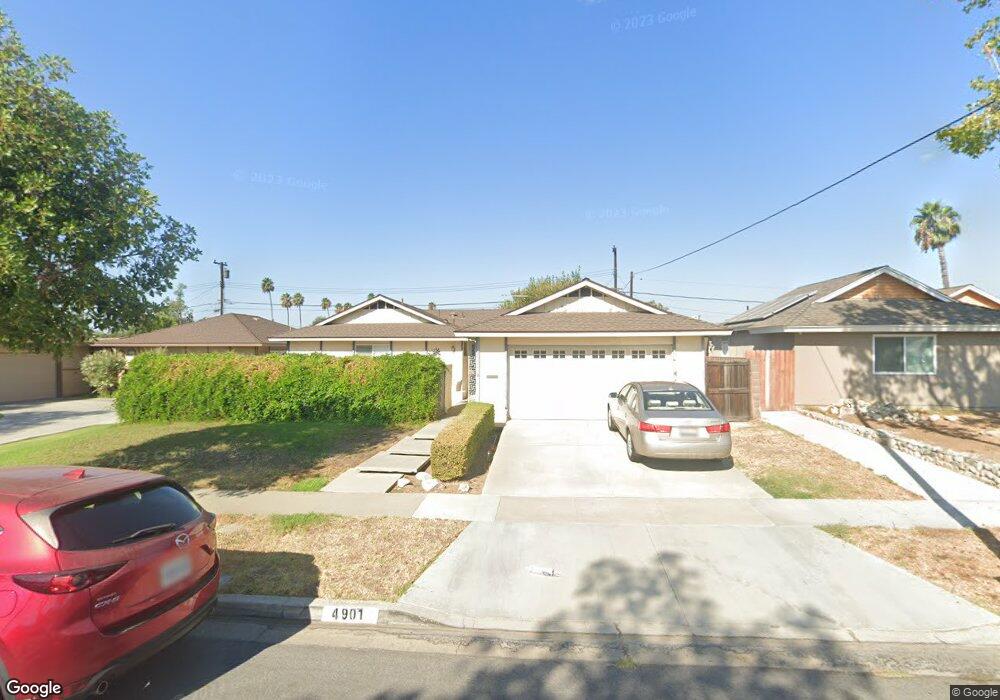
4901 Casa Oro Dr Yorba Linda, CA 92886
Estimated Value: $1,107,992 - $1,206,000
4
Beds
2
Baths
1,712
Sq Ft
$679/Sq Ft
Est. Value
About This Home
This home is located at 4901 Casa Oro Dr, Yorba Linda, CA 92886 and is currently estimated at $1,161,998, approximately $678 per square foot. 4901 Casa Oro Dr is a home located in Orange County with nearby schools including Rose Drive Elementary, Yorba Linda Middle School, and El Dorado High School.
Ownership History
Date
Name
Owned For
Owner Type
Purchase Details
Closed on
Aug 11, 2003
Sold by
Corbin Todd M and Corbin Kimberly
Bought by
Rose Randal D and Rose Jennie C
Current Estimated Value
Home Financials for this Owner
Home Financials are based on the most recent Mortgage that was taken out on this home.
Original Mortgage
$352,000
Outstanding Balance
$154,780
Interest Rate
5.6%
Mortgage Type
Purchase Money Mortgage
Estimated Equity
$1,007,218
Purchase Details
Closed on
Jan 18, 1996
Sold by
World S & L Assn
Bought by
Corbin Todd M and Corbin Kimberly
Home Financials for this Owner
Home Financials are based on the most recent Mortgage that was taken out on this home.
Original Mortgage
$183,350
Interest Rate
7.25%
Purchase Details
Closed on
Sep 1, 1995
Sold by
Zwayne Francis R
Bought by
World S & L Assn
Create a Home Valuation Report for This Property
The Home Valuation Report is an in-depth analysis detailing your home's value as well as a comparison with similar homes in the area
Home Values in the Area
Average Home Value in this Area
Purchase History
| Date | Buyer | Sale Price | Title Company |
|---|---|---|---|
| Rose Randal D | $472,000 | Southland Title Corporation | |
| Corbin Todd M | $193,000 | Fidelity National Title Ins | |
| World S & L Assn | $174,170 | -- |
Source: Public Records
Mortgage History
| Date | Status | Borrower | Loan Amount |
|---|---|---|---|
| Open | Rose Randal D | $352,000 | |
| Previous Owner | Corbin Todd M | $183,350 |
Source: Public Records
Tax History Compared to Growth
Tax History
| Year | Tax Paid | Tax Assessment Tax Assessment Total Assessment is a certain percentage of the fair market value that is determined by local assessors to be the total taxable value of land and additions on the property. | Land | Improvement |
|---|---|---|---|---|
| 2025 | $7,472 | $671,077 | $558,177 | $112,900 |
| 2024 | $7,472 | $657,919 | $547,232 | $110,687 |
| 2023 | $7,341 | $645,019 | $536,502 | $108,517 |
| 2022 | $7,272 | $632,372 | $525,982 | $106,390 |
| 2021 | $7,144 | $619,973 | $515,669 | $104,304 |
| 2020 | $7,094 | $613,616 | $510,381 | $103,235 |
| 2019 | $6,842 | $601,585 | $500,374 | $101,211 |
| 2018 | $6,756 | $589,790 | $490,563 | $99,227 |
| 2017 | $6,646 | $578,226 | $480,944 | $97,282 |
| 2016 | $6,511 | $566,889 | $471,514 | $95,375 |
| 2015 | $6,432 | $558,374 | $464,431 | $93,943 |
| 2014 | $6,241 | $547,437 | $455,334 | $92,103 |
Source: Public Records
Map
Nearby Homes
- 5130 Webb Place
- 17001 La Kenice Way
- 4781 Kona Kove Way
- 4802 Brookway Ave
- 1429 Prospect Ave Unit B
- 1261 Desoto St
- 17781 Lerene Dr
- 4942 Gem Ln
- 16692 Meadowview Dr
- 5141 Siesta Ln
- 11715 Rose Dr
- 4891 Eureka Ave Unit 25
- 4845 Eisenhower Ct
- 5231 Highland Ave
- 4571 Mimosa Dr
- 4882 Kermath St
- 18083 Burke Ln
- 4215 Sand Rock Cir
- 1551 E Ray Dr
- 17841 Buena Vista Ave
- 4911 Casa Oro Dr
- 4891 Casa Oro Dr
- 4902 Briarhill Dr
- 4921 Casa Oro Dr
- 17222 Regulus Dr
- 4912 Briarhill Dr
- 4902 Casa Oro Dr
- 4941 Casa Oro Dr
- 4932 Briarhill Dr
- 4912 Casa Oro Dr
- 4892 Casa Oro Dr
- 17231 Regulus Dr
- 17241 Regulus Dr
- 4922 Casa Oro Dr
- 17221 Regulus Dr
- 17251 Regulus Dr
- 4951 Casa Oro Dr
- 4942 Casa Oro Dr
- 4942 Briarhill Dr
- 4891 Briarhill Dr