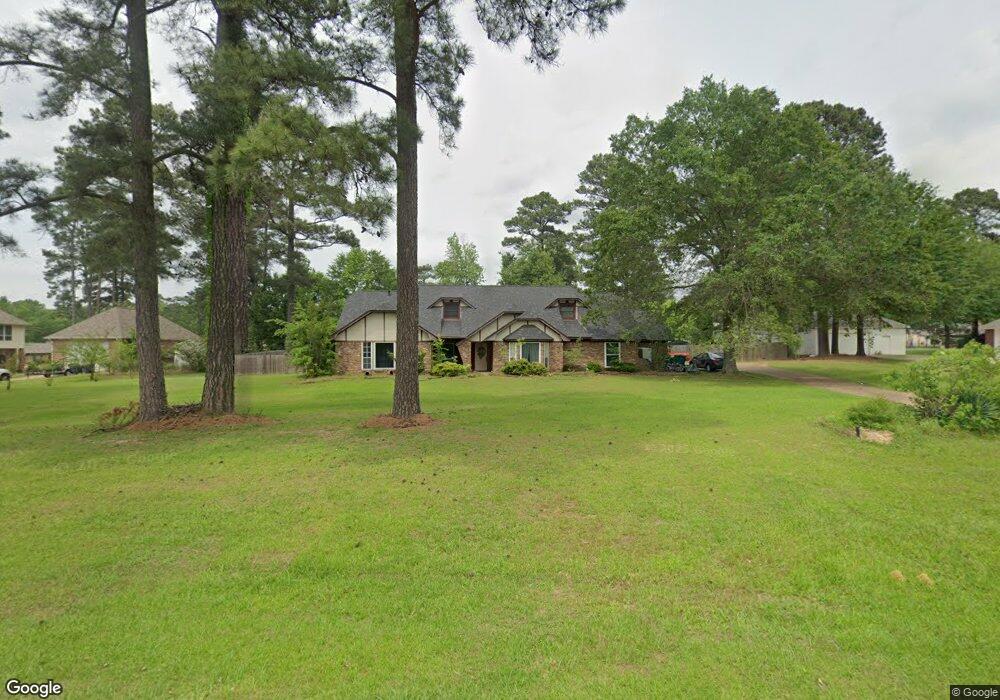
4906 Lesley Ln Texarkana, TX 75503
Estimated Value: $317,395 - $373,000
3
Beds
3
Baths
2,672
Sq Ft
$133/Sq Ft
Est. Value
About This Home
This home is located at 4906 Lesley Ln, Texarkana, TX 75503 and is currently estimated at $355,599, approximately $133 per square foot. 4906 Lesley Ln is a home located in Bowie County with nearby schools including Waggoner Creek Elementary School, Texas Middle School, and Texas High School.
Ownership History
Date
Name
Owned For
Owner Type
Purchase Details
Closed on
Jun 26, 2018
Sold by
Bonilla Nestor R and Bonilla Magda L
Bought by
Williams Cory D and Williams Alyssa K
Current Estimated Value
Home Financials for this Owner
Home Financials are based on the most recent Mortgage that was taken out on this home.
Original Mortgage
$195,918
Outstanding Balance
$169,816
Interest Rate
4.6%
Mortgage Type
Purchase Money Mortgage
Estimated Equity
$185,783
Purchase Details
Closed on
Mar 9, 2006
Sold by
Fawbush Jason and Fawbush Leslie A
Bought by
Bonilla Nestor A
Purchase Details
Closed on
Feb 3, 2005
Sold by
Williamson Aven C
Bought by
Fawbush Jason Ramon and Fawbush Leslie Ann
Home Financials for this Owner
Home Financials are based on the most recent Mortgage that was taken out on this home.
Original Mortgage
$60,000
Interest Rate
7.25%
Mortgage Type
Adjustable Rate Mortgage/ARM
Create a Home Valuation Report for This Property
The Home Valuation Report is an in-depth analysis detailing your home's value as well as a comparison with similar homes in the area
Home Values in the Area
Average Home Value in this Area
Purchase History
| Date | Buyer | Sale Price | Title Company |
|---|---|---|---|
| Williams Cory D | -- | None Available | |
| Bonilla Nestor A | -- | None Available | |
| Fawbush Jason Ramon | -- | None Available |
Source: Public Records
Mortgage History
| Date | Status | Borrower | Loan Amount |
|---|---|---|---|
| Open | Williams Cory D | $195,918 | |
| Previous Owner | Fawbush Jason Ramon | $60,000 | |
| Closed | Bonilla Nestor A | -- |
Source: Public Records
Tax History Compared to Growth
Tax History
| Year | Tax Paid | Tax Assessment Tax Assessment Total Assessment is a certain percentage of the fair market value that is determined by local assessors to be the total taxable value of land and additions on the property. | Land | Improvement |
|---|---|---|---|---|
| 2025 | $5,864 | $322,423 | $25,000 | $297,423 |
| 2024 | $5,864 | $309,156 | $25,000 | $297,146 |
| 2023 | $6,655 | $281,051 | $0 | $0 |
| 2022 | $6,099 | $276,535 | $25,000 | $251,535 |
| 2021 | $5,939 | $232,274 | $20,000 | $212,274 |
| 2020 | $5,720 | $222,512 | $20,000 | $202,512 |
| 2019 | $5,687 | $213,206 | $20,000 | $193,206 |
| 2018 | $5,496 | $206,033 | $20,000 | $186,033 |
| 2017 | $5,387 | $202,530 | $20,000 | $182,530 |
| 2016 | $4,707 | $176,934 | $20,000 | $156,934 |
| 2015 | $4,501 | $175,423 | $20,000 | $155,423 |
| 2014 | $4,501 | $173,959 | $20,000 | $153,959 |
Source: Public Records
Map
Nearby Homes
- 2 Windmere Dr
- 24 Windmere Place
- N/A Richmond Meadows
- 3133 Pleasant Grove Rd
- 4011 Columbine Ln
- 34 Dustin Terrace
- Lot 1 Blk 2 Cooper Lane Est III
- 5617 Deaton Place
- 5619 Deaton Place
- 180 Ochsenbein Rd
- 5614 Deaton Place
- 21 Dustin Terrace
- 0 Collins Rd Unit 20899332
- 5500 Pleasant Grove Rd
- 101 Sierra Madre Ln
- 500 Wade Ln
- 58 Green Oak Cir
- 2907 Pleasant Grove Rd
- 0 Greenbriar Lot 14
- TBD Hidden Ac Dr Lot 17
- 4904 Lesley Ln
- 2706 Elizabeth Ann St
- 2702 Elizabeth Ann St
- 4909 Lesley Ln
- 4907 Lesley Ln
- 4902 Lesley Ln
- 2805 Jonathan St
- 2807 Jonathan St
- 4911 Lesley Ln
- 4905 Lesley Ln
- 2803 Jonathan St
- 0 Leslie Ln Unit 109132
- 0 Leslie Ln Unit 109131
- 2701 Jonathan St
- 2705 Elizabeth Ann St
- 2703 Elizabeth Ann St
- 2707 Elizabeth Ann St
- 4903 Lesley Ln
- 4910 Lesley Ln
- 0 Lesley Ln