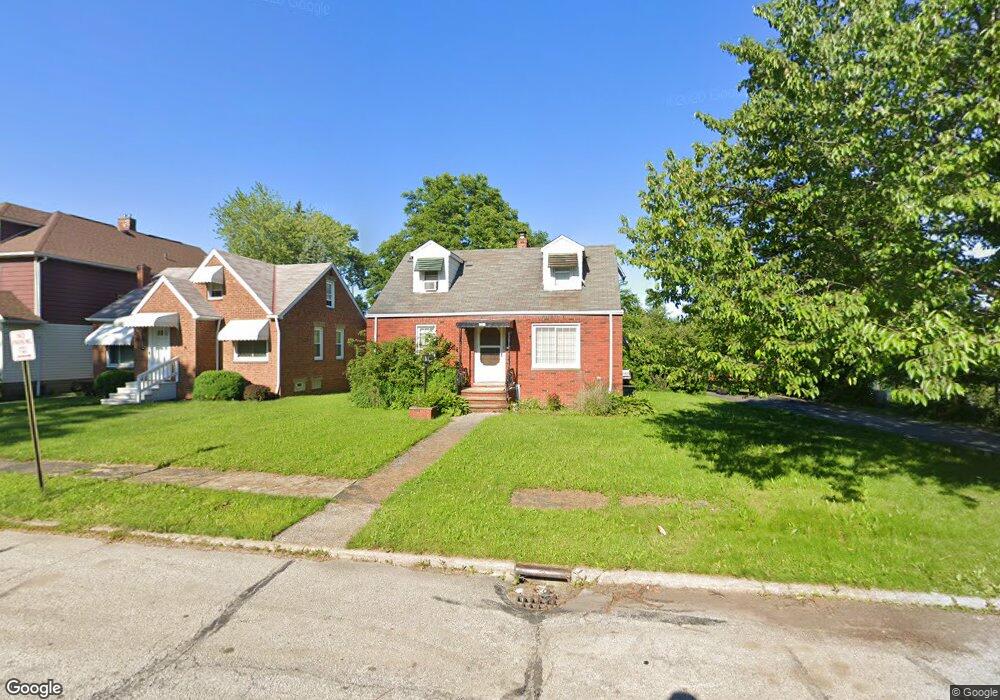
4909 E 97th St Cleveland, OH 44125
Estimated Value: $110,662 - $127,000
3
Beds
1
Bath
1,170
Sq Ft
$102/Sq Ft
Est. Value
About This Home
This home is located at 4909 E 97th St, Cleveland, OH 44125 and is currently estimated at $118,916, approximately $101 per square foot. 4909 E 97th St is a home located in Cuyahoga County with nearby schools including Garfield Heights High School, North Shore High School, and Holy Name Elementary School.
Ownership History
Date
Name
Owned For
Owner Type
Purchase Details
Closed on
Oct 10, 2009
Sold by
Rocco Bill and Rocco William P
Bought by
Rocco Gina M
Current Estimated Value
Purchase Details
Closed on
Mar 11, 2003
Sold by
Rocco William P and Rocco Gina M
Bought by
Rocco William P and Rocco Gina M
Purchase Details
Closed on
Oct 30, 2000
Sold by
Rocco Patrick R
Bought by
Rocco William P
Home Financials for this Owner
Home Financials are based on the most recent Mortgage that was taken out on this home.
Original Mortgage
$43,800
Outstanding Balance
$16,128
Interest Rate
7.87%
Estimated Equity
$102,788
Purchase Details
Closed on
Apr 2, 1979
Sold by
Rocco Patsy F
Bought by
Rocco Patsy F
Purchase Details
Closed on
Apr 19, 1978
Sold by
Rocco Patsy F and Rocco Clara M
Bought by
Rocco Patsy F
Purchase Details
Closed on
Jan 1, 1975
Bought by
Rocco Patsy F and Rocco Clara M
Create a Home Valuation Report for This Property
The Home Valuation Report is an in-depth analysis detailing your home's value as well as a comparison with similar homes in the area
Home Values in the Area
Average Home Value in this Area
Purchase History
| Date | Buyer | Sale Price | Title Company |
|---|---|---|---|
| Rocco Gina M | -- | Attorney | |
| Rocco William P | -- | -- | |
| Rocco William P | $20,000 | Quality Title Agency Inc | |
| Rocco Joseph A | -- | Quality Title Agency Inc | |
| Rocco Patsy F | -- | -- | |
| Rocco Patsy F | -- | -- | |
| Rocco Patsy F | -- | -- |
Source: Public Records
Mortgage History
| Date | Status | Borrower | Loan Amount |
|---|---|---|---|
| Open | Rocco William P | $43,800 |
Source: Public Records
Tax History Compared to Growth
Tax History
| Year | Tax Paid | Tax Assessment Tax Assessment Total Assessment is a certain percentage of the fair market value that is determined by local assessors to be the total taxable value of land and additions on the property. | Land | Improvement |
|---|---|---|---|---|
| 2024 | $4,096 | $38,535 | $9,030 | $29,505 |
| 2023 | $2,971 | $25,410 | $6,160 | $19,250 |
| 2022 | $2,920 | $25,410 | $6,160 | $19,250 |
| 2021 | $3,083 | $25,410 | $6,160 | $19,250 |
| 2020 | $2,660 | $20,340 | $4,940 | $15,400 |
| 2019 | $2,638 | $58,100 | $14,100 | $44,000 |
| 2018 | $2,605 | $20,340 | $4,940 | $15,400 |
| 2017 | $2,599 | $18,830 | $3,920 | $14,910 |
| 2016 | $2,636 | $18,830 | $3,920 | $14,910 |
| 2015 | $2,896 | $18,830 | $3,920 | $14,910 |
| 2014 | $2,896 | $22,960 | $4,760 | $18,200 |
Source: Public Records
Map
Nearby Homes
- 4883 E 96th St
- 4859 E 97th St
- 4864 E 96th St
- 9513 David Rd
- 4839 E 94th St
- 4903 E 94th St
- 10209 Runnymede Ave
- 10105 Russell Ave
- 10307 Russell Ave
- 4846 Edgepark Dr
- 10000 Greenview Ave
- 10403 Russell Ave
- 4932 E 93rd St
- 9435 Dorothy Ave
- 4953 E 106th St
- 10105 Greenview Ave
- 4769 E 90th St
- 10201 Greenview Ave
- 4885 E 107th St
- 4969 E 90th St
- 4903 E 97th St
- 4899 E 97th St
- 4906 E 97th St
- 4893 E 97th St
- 4902 E 97th St
- 4900 E 97th St
- 4896 E 97th St
- 4889 E 97th St
- 4892 E 97th St
- 4886 E 97th St
- 4919 E 96th St
- 4879 E 97th St
- 4907 E 96th St
- 4911 E 96th St
- 4882 E 97th St
- 4903 E 96th St
- 4899 E 96th St Unit 2/UP
- 4899 E 96th St Unit DN
- 4899 E 96th St Unit UP
- 4895 E 96th St