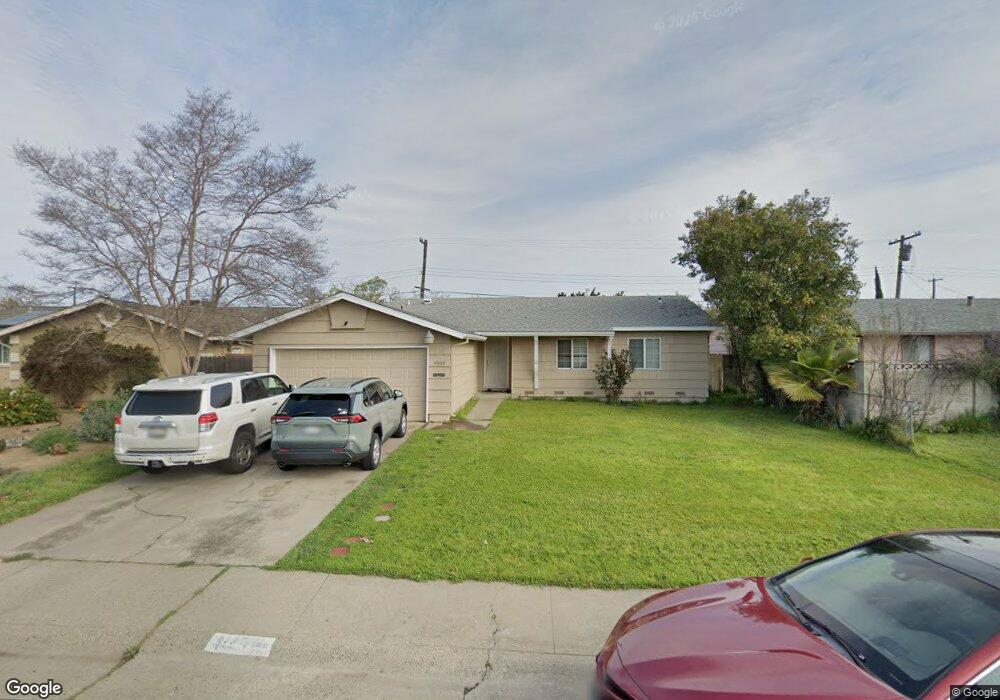
4909 Sky Pkwy Sacramento, CA 95823
Estimated Value: $324,000 - $403,000
3
Beds
2
Baths
1,193
Sq Ft
$315/Sq Ft
Est. Value
About This Home
This home is located at 4909 Sky Pkwy, Sacramento, CA 95823 and is currently estimated at $376,260, approximately $315 per square foot. 4909 Sky Pkwy is a home located in Sacramento County with nearby schools including Clayton B. Wire Elementary School, Fern Bacon Middle School, and Luther Burbank High School.
Ownership History
Date
Name
Owned For
Owner Type
Purchase Details
Closed on
Mar 19, 2010
Sold by
Horan Investment Co
Bought by
Zhang Zhi Yuan
Current Estimated Value
Purchase Details
Closed on
Mar 2, 2010
Sold by
Kesserwani Samouil
Bought by
Horan Investment Co
Purchase Details
Closed on
May 12, 2006
Sold by
Alvarez Domira
Bought by
Kesserwani Samouil
Home Financials for this Owner
Home Financials are based on the most recent Mortgage that was taken out on this home.
Original Mortgage
$212,353
Interest Rate
6.37%
Mortgage Type
Purchase Money Mortgage
Purchase Details
Closed on
Dec 20, 2002
Sold by
Lundy Rosalie and Edna E Dionkel Trust
Bought by
Alvarez Domira
Home Financials for this Owner
Home Financials are based on the most recent Mortgage that was taken out on this home.
Original Mortgage
$162,000
Interest Rate
6.03%
Purchase Details
Closed on
Feb 22, 1996
Sold by
Dinkel Edna E
Bought by
Dinkel Edna E and Lundy Rosalie
Create a Home Valuation Report for This Property
The Home Valuation Report is an in-depth analysis detailing your home's value as well as a comparison with similar homes in the area
Home Values in the Area
Average Home Value in this Area
Purchase History
| Date | Buyer | Sale Price | Title Company |
|---|---|---|---|
| Zhang Zhi Yuan | $116,000 | Placer Title Company | |
| Horan Investment Co | $88,000 | None Available | |
| Kesserwani Samouil | $265,500 | Alliance Title Company | |
| Alvarez Domira | $162,000 | Alliance Title Company | |
| Dinkel Edna E | -- | -- |
Source: Public Records
Mortgage History
| Date | Status | Borrower | Loan Amount |
|---|---|---|---|
| Previous Owner | Kesserwani Samouil | $212,353 | |
| Previous Owner | Alvarez Domira | $162,000 |
Source: Public Records
Tax History Compared to Growth
Tax History
| Year | Tax Paid | Tax Assessment Tax Assessment Total Assessment is a certain percentage of the fair market value that is determined by local assessors to be the total taxable value of land and additions on the property. | Land | Improvement |
|---|---|---|---|---|
| 2025 | $1,780 | $149,718 | $23,484 | $126,234 |
| 2024 | $1,780 | $146,783 | $23,024 | $123,759 |
| 2023 | $1,731 | $143,906 | $22,573 | $121,333 |
| 2022 | $1,717 | $141,085 | $22,131 | $118,954 |
| 2021 | $1,631 | $138,320 | $21,698 | $116,622 |
| 2020 | $1,640 | $136,903 | $21,476 | $115,427 |
| 2019 | $1,605 | $134,219 | $21,055 | $113,164 |
| 2018 | $1,563 | $131,589 | $20,643 | $110,946 |
| 2017 | $1,538 | $129,010 | $20,239 | $108,771 |
| 2016 | $1,468 | $126,482 | $19,843 | $106,639 |
| 2015 | $1,442 | $124,583 | $19,545 | $105,038 |
| 2014 | $1,409 | $122,144 | $19,163 | $102,981 |
Source: Public Records
Map
Nearby Homes
- 6629 Doreen Way
- 5206 Satellite Pkwy
- 6814 Chevy Chase Way
- 5201 Sky Pkwy
- 4304 Greenwich Cir
- 6811 Bowling Dr
- 4210 Turnbridge Dr
- 4165 Cuny Ave
- 5616 53rd Ave
- 6623 Prentiss Dr
- 5607 Manmar Way
- 4320 46th Ave
- 4721 A Pkwy
- 6236 Welty Way
- 7304 East Pkwy
- 5705 Manmar Way
- 6244 Donnelly Ln
- Plan 1 - 1706 at Park Place
- Plan 2 - 1945 at Park Place
- 5206 Senesta Cir
- 4913 Sky Pkwy
- 4905 Sky Pkwy
- 4917 Sky Pkwy
- 4901 Sky Pkwy
- 4900 Sky Pkwy
- 4912 Sky Pkwy
- 4921 Sky Pkwy
- 4604 Livingston Way
- 4900 1st Pkwy
- 4916 Sky Pkwy
- 4608 Livingston Way
- 4600 Livingston Way
- 4909 1st Pkwy
- 4612 Livingston Way
- 4920 Sky Pkwy
- 4904 1st Pkwy
- 4524 Livingston Way
- 4923 Sky Pkwy
- 4616 Livingston Way
- 4924 Sky Pkwy