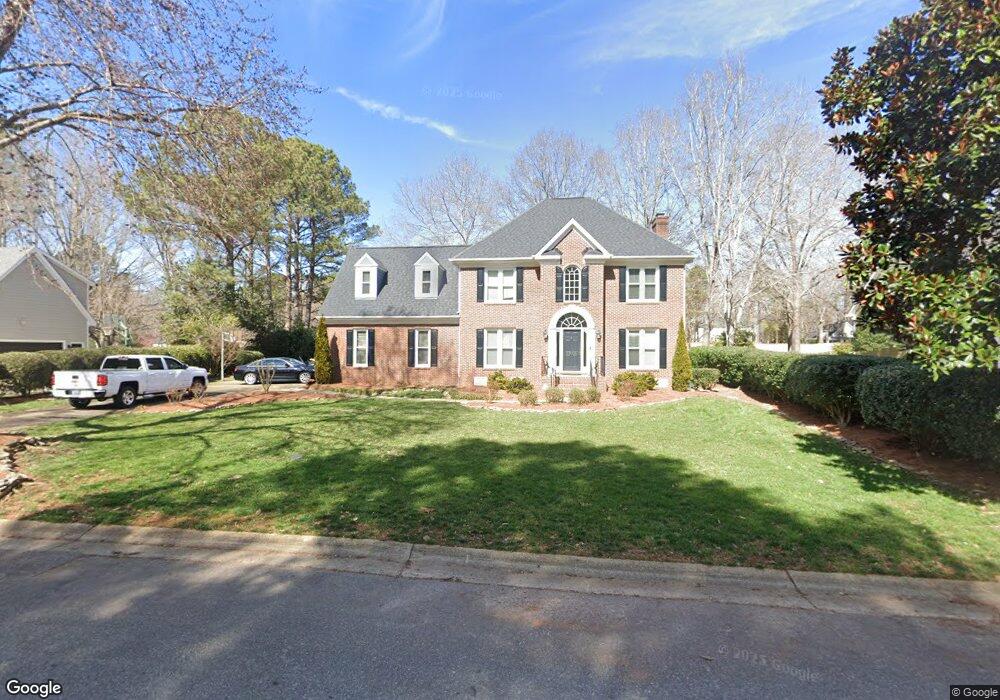
4913 Sun Lake Ct Holly Springs, NC 27540
Estimated Value: $743,206 - $776,000
4
Beds
3
Baths
2,861
Sq Ft
$265/Sq Ft
Est. Value
About This Home
This home is located at 4913 Sun Lake Ct, Holly Springs, NC 27540 and is currently estimated at $757,802, approximately $264 per square foot. 4913 Sun Lake Ct is a home located in Wake County with nearby schools including Holly Ridge Elementary School, Holly Ridge Middle School, and Holly Springs High School.
Ownership History
Date
Name
Owned For
Owner Type
Purchase Details
Closed on
Jan 29, 2015
Sold by
Myers John L and Myers Erika
Bought by
Goldner Brian F and Gherghel Gabriela M
Current Estimated Value
Home Financials for this Owner
Home Financials are based on the most recent Mortgage that was taken out on this home.
Original Mortgage
$295,000
Outstanding Balance
$226,944
Interest Rate
3.88%
Mortgage Type
New Conventional
Estimated Equity
$530,858
Purchase Details
Closed on
Aug 24, 2007
Sold by
Hirschman James and Hirschman Wendy
Bought by
Myers John L
Home Financials for this Owner
Home Financials are based on the most recent Mortgage that was taken out on this home.
Original Mortgage
$308,400
Interest Rate
6.7%
Mortgage Type
Purchase Money Mortgage
Purchase Details
Closed on
Nov 29, 2005
Sold by
Nrt Relocation Llc
Bought by
Hirschman James and Hirschman Wendy
Purchase Details
Closed on
Oct 10, 2005
Sold by
Martin Paul G and Martin Elizabeth W
Bought by
Nrt Relocation Llc
Create a Home Valuation Report for This Property
The Home Valuation Report is an in-depth analysis detailing your home's value as well as a comparison with similar homes in the area
Home Values in the Area
Average Home Value in this Area
Purchase History
| Date | Buyer | Sale Price | Title Company |
|---|---|---|---|
| Goldner Brian F | $375,000 | None Available | |
| Myers John L | $385,500 | None Available | |
| Hirschman James | $415,000 | None Available | |
| Nrt Relocation Llc | $415,000 | None Available |
Source: Public Records
Mortgage History
| Date | Status | Borrower | Loan Amount |
|---|---|---|---|
| Open | Goldner Brian F | $295,000 | |
| Previous Owner | Myers John L | $308,400 |
Source: Public Records
Tax History Compared to Growth
Tax History
| Year | Tax Paid | Tax Assessment Tax Assessment Total Assessment is a certain percentage of the fair market value that is determined by local assessors to be the total taxable value of land and additions on the property. | Land | Improvement |
|---|---|---|---|---|
| 2025 | $6,286 | $728,048 | $232,500 | $495,548 |
| 2024 | $6,259 | $728,048 | $232,500 | $495,548 |
| 2023 | $4,723 | $436,021 | $117,000 | $319,021 |
| 2022 | $4,559 | $436,021 | $117,000 | $319,021 |
| 2021 | $4,474 | $436,021 | $117,000 | $319,021 |
| 2020 | $4,474 | $436,021 | $117,000 | $319,021 |
| 2019 | $4,572 | $378,313 | $117,000 | $261,313 |
| 2018 | $4,132 | $378,313 | $117,000 | $261,313 |
| 2017 | $3,983 | $378,313 | $117,000 | $261,313 |
| 2016 | $3,928 | $378,313 | $117,000 | $261,313 |
| 2015 | $4,091 | $387,904 | $114,400 | $273,504 |
| 2014 | $3,949 | $387,904 | $114,400 | $273,504 |
Source: Public Records
Map
Nearby Homes
- 5309 Shoreline Ct
- 5420 Lake Edge Dr
- 5200 Gable Ridge Ln
- 5317 Moonflower Ct
- 717 Bass Lake Rd
- 4809 Greenpoint Ln
- 1108 Braswell Creek Point
- 404 Prince Dr
- 305 Savannah Ridge Rd
- 204 Horncliffe Way
- 215 Savannah Ridge Rd Unit 215
- 0/416 Holly Springs Rd
- 504 Prince Dr
- 212 Chieftain Dr
- 204 Crossway Ln
- 108 Eden Glen Dr
- 101 Eden Glen Dr
- 137 Lacombe Ct
- 109 Lacombe Ct
- 500 Eno Dr
- 4917 Sun Lake Ct
- 4909 Sun Lake Ct
- 4921 Sun Lake Ct
- 4905 Sun Lake Ct
- 4908 Sun Lake Ct
- 4912 Sun Lake Ct
- 4925 Sun Lake Ct
- 4901 Sun Lake Ct
- 4916 Sun Lake Ct
- 4900 Sun Lake Ct
- 5013 Salem Ridge Rd
- 4920 Sun Lake Ct
- 4929 Sun Lake Ct
- 5009 Salem Ridge Rd
- 5220 Lake Edge Dr
- 5301 Shoreline Ct
- 5224 Lake Edge Dr
- 5216 Lake Edge Dr
- 5317 Shoreline Ct
- 5228 Lake Edge Dr