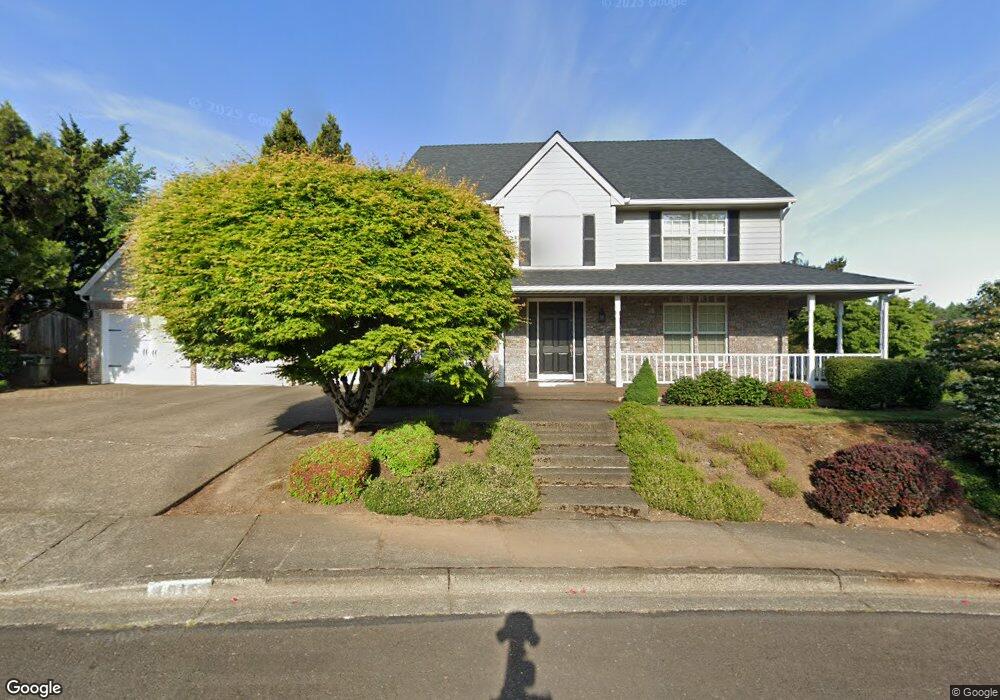
4915 Chauncey Ct SE Salem, OR 97302
Morningside NeighborhoodEstimated Value: $774,542 - $945,000
4
Beds
3
Baths
3,718
Sq Ft
$238/Sq Ft
Est. Value
About This Home
This home is located at 4915 Chauncey Ct SE, Salem, OR 97302 and is currently estimated at $883,636, approximately $237 per square foot. 4915 Chauncey Ct SE is a home located in Marion County with nearby schools including Pringle Elementary School, Judson Middle School, and South Salem High School.
Ownership History
Date
Name
Owned For
Owner Type
Purchase Details
Closed on
Jul 23, 2008
Sold by
Burrell J Michael and Burrell Barbara J
Bought by
Phillips Trevor G and Phillips Michelle M
Current Estimated Value
Home Financials for this Owner
Home Financials are based on the most recent Mortgage that was taken out on this home.
Original Mortgage
$400,000
Outstanding Balance
$260,068
Interest Rate
6.31%
Mortgage Type
Purchase Money Mortgage
Estimated Equity
$623,568
Create a Home Valuation Report for This Property
The Home Valuation Report is an in-depth analysis detailing your home's value as well as a comparison with similar homes in the area
Home Values in the Area
Average Home Value in this Area
Purchase History
| Date | Buyer | Sale Price | Title Company |
|---|---|---|---|
| Phillips Trevor G | $500,000 | Ticor Title |
Source: Public Records
Mortgage History
| Date | Status | Borrower | Loan Amount |
|---|---|---|---|
| Open | Phillips Trevor G | $400,000 |
Source: Public Records
Tax History Compared to Growth
Tax History
| Year | Tax Paid | Tax Assessment Tax Assessment Total Assessment is a certain percentage of the fair market value that is determined by local assessors to be the total taxable value of land and additions on the property. | Land | Improvement |
|---|---|---|---|---|
| 2025 | $10,882 | $570,870 | -- | -- |
| 2024 | $10,882 | $554,250 | -- | -- |
| 2023 | $10,561 | $538,110 | $0 | $0 |
| 2022 | $9,958 | $522,440 | $0 | $0 |
| 2021 | $9,673 | $507,230 | $0 | $0 |
| 2020 | $9,391 | $492,460 | $0 | $0 |
| 2019 | $9,061 | $478,120 | $0 | $0 |
| 2018 | $9,221 | $0 | $0 | $0 |
| 2017 | $8,323 | $0 | $0 | $0 |
| 2016 | $7,754 | $0 | $0 | $0 |
| 2015 | $7,758 | $0 | $0 | $0 |
| 2014 | $6,679 | $0 | $0 | $0 |
Source: Public Records
Map
Nearby Homes
- 4943 Southampton Dr SE
- 4797 Constitution Ave SE
- 5065 Barnes Ct SE
- 2175 Churchill Ave SE
- 2259 Alex Ct SE
- 4697 Southampton Dr SE
- 4586 Constitution Ave SE
- 1532 Webster Dr SE
- 1918 Riting Ct SE
- 2023 Lone Fir Ct SE
- 2324 Thrush Ct SE
- 1615 Harlandale Ave SE
- 1540 Harlandale Ave SE
- 4417 Battle Creek Rd SE
- 4540 Sunland St SE
- 5095 Cultus Ave SE
- 4535 Sunland St SE
- 5447 Sugar Plum St SE
- 5173 Fort Rock Ave SE
- 0 Battle Creek Rd SE
- 4935 Chauncey Ct SE
- 1930 Wickshire Ave SE
- 4930 Albion Ct SE
- 4910 Chauncey Ct SE
- 1975 Wickshire Ave SE
- 4930 Chauncey Ct SE
- 4955 Chauncey Ct SE
- 4950 Albion Ct SE
- 1935 Wickshire Ave SE
- 4890 Chauncey St SE
- 4903 Albion Ct SE
- 4923 Albion Ct SE
- 4923 Southampton Dr SE
- 1865 Wickshire Ave SE
- 4933 Southampton Dr SE
- 4975 Chauncey Ct SE
- 1980 Webster Dr SE
- 4943 Albion Ct SE
- 4970 Albion Ct SE
- 4870 Chauncey St SE