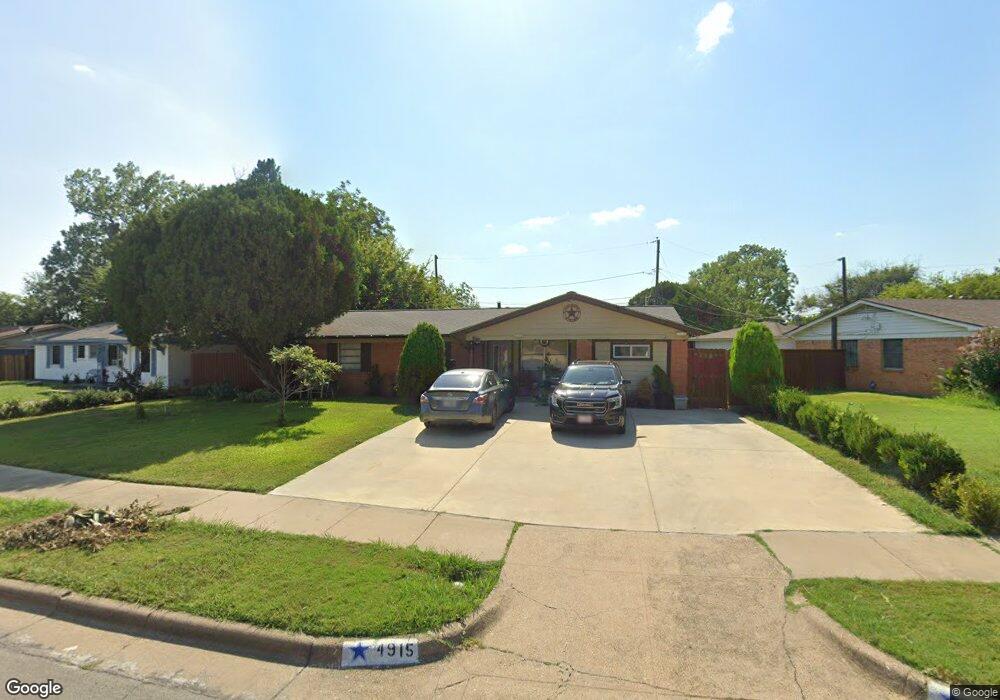
4915 Dupont Dr Dallas, TX 75216
Cedar Crest NeighborhoodEstimated Value: $173,000 - $241,000
3
Beds
1
Bath
1,158
Sq Ft
$175/Sq Ft
Est. Value
About This Home
This home is located at 4915 Dupont Dr, Dallas, TX 75216 and is currently estimated at $202,555, approximately $174 per square foot. 4915 Dupont Dr is a home located in Dallas County with nearby schools including Whitney M. Young Jr. Elementary School, Dr. Frederick Douglass Todd Sr., and South Oak Cliff High School.
Ownership History
Date
Name
Owned For
Owner Type
Purchase Details
Closed on
Oct 30, 2024
Sold by
Reyna Alberto
Bought by
Contreras Castro Elidia
Current Estimated Value
Purchase Details
Closed on
Sep 24, 2015
Sold by
Wells Fargo Bank Na
Bought by
Reyna Alberto
Purchase Details
Closed on
Aug 17, 2015
Sold by
Federal National Mortgage Association
Bought by
Wells Fargo Bank Na
Purchase Details
Closed on
Sep 6, 2011
Sold by
Clark Katie Mae
Bought by
Federal National Mortgage Association and Fannie Mae
Purchase Details
Closed on
Jan 17, 2001
Sold by
Savage Mildred H
Bought by
Clark Katie
Home Financials for this Owner
Home Financials are based on the most recent Mortgage that was taken out on this home.
Original Mortgage
$6,900
Interest Rate
7.55%
Mortgage Type
Seller Take Back
Create a Home Valuation Report for This Property
The Home Valuation Report is an in-depth analysis detailing your home's value as well as a comparison with similar homes in the area
Home Values in the Area
Average Home Value in this Area
Purchase History
| Date | Buyer | Sale Price | Title Company |
|---|---|---|---|
| Contreras Castro Elidia | -- | None Listed On Document | |
| Reyna Alberto | -- | None Available | |
| Wells Fargo Bank Na | -- | Stewart Title Company | |
| Federal National Mortgage Association | $60,934 | None Available | |
| Clark Katie | -- | -- |
Source: Public Records
Mortgage History
| Date | Status | Borrower | Loan Amount |
|---|---|---|---|
| Previous Owner | Clark Katie | $6,900 |
Source: Public Records
Tax History Compared to Growth
Tax History
| Year | Tax Paid | Tax Assessment Tax Assessment Total Assessment is a certain percentage of the fair market value that is determined by local assessors to be the total taxable value of land and additions on the property. | Land | Improvement |
|---|---|---|---|---|
| 2025 | $4,380 | $204,270 | $60,000 | $144,270 |
| 2024 | $4,380 | $202,030 | $60,000 | $142,030 |
| 2023 | $4,380 | $163,310 | $35,000 | $128,310 |
| 2022 | $4,083 | $163,310 | $35,000 | $128,310 |
| 2021 | $3,476 | $131,780 | $25,000 | $106,780 |
| 2020 | $2,951 | $108,770 | $15,000 | $93,770 |
| 2019 | $3,095 | $108,770 | $15,000 | $93,770 |
| 2018 | $884 | $32,500 | $9,000 | $23,500 |
| 2017 | $884 | $32,500 | $9,000 | $23,500 |
| 2016 | $884 | $32,500 | $9,000 | $23,500 |
| 2015 | $1,589 | $48,160 | $9,000 | $39,160 |
| 2014 | $1,589 | $57,940 | $9,000 | $48,940 |
Source: Public Records
Map
Nearby Homes
- 2217 52nd St
- 2309 52nd St
- 4927 Eastgate Cir
- 2358 Inca Dr
- 2365 Clover Ridge Dr
- 4715 S Denley Dr
- 5006 Bartlett Ave
- 4619 S Denley Dr
- 2433 52nd St
- 4833 Kildare Ave
- 4610 Gracey St
- 1833 Atlas Dr
- 5116 Wynell St
- 1823 Atlas Dr
- 1815 Kingsley Dr
- 5151 S Denley Dr
- 1817 Adelaide Dr
- 2508 Marjorie Ave
- 4311 Gladewater Rd
- 2524 Marjorie Ave