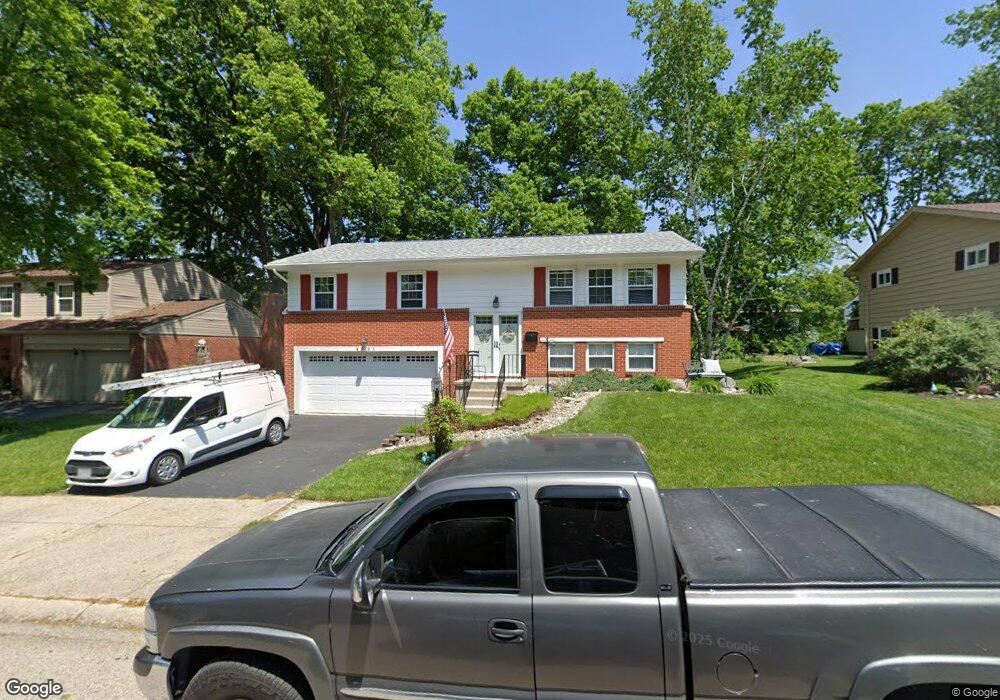
4921 Pepperwood Dr Dayton, OH 45424
Forest Ridge Quail Hollow NeighborhoodEstimated Value: $228,737 - $261,000
3
Beds
3
Baths
1,276
Sq Ft
$193/Sq Ft
Est. Value
About This Home
This home is located at 4921 Pepperwood Dr, Dayton, OH 45424 and is currently estimated at $245,684, approximately $192 per square foot. 4921 Pepperwood Dr is a home located in Montgomery County with nearby schools including Stebbins High School, Pathway School of Discovery, and St. Helen Elementary School.
Ownership History
Date
Name
Owned For
Owner Type
Purchase Details
Closed on
Jan 23, 2008
Sold by
Smotherman John B
Bought by
Smotherman John B and Smotherman Paula M
Current Estimated Value
Purchase Details
Closed on
Sep 8, 2003
Sold by
Sparks Virgil M and Sparks Deborah K
Bought by
Smotherman John B
Home Financials for this Owner
Home Financials are based on the most recent Mortgage that was taken out on this home.
Original Mortgage
$103,200
Outstanding Balance
$47,677
Interest Rate
6.18%
Mortgage Type
Purchase Money Mortgage
Estimated Equity
$198,007
Purchase Details
Closed on
Aug 24, 2001
Sold by
Sparks Larry Wayne and Sparks Charlene K
Bought by
Sparks Virgil M and Sparks Deborah K
Purchase Details
Closed on
Oct 26, 2000
Sold by
Estate Of Robert Sparks
Bought by
Sparks Larry Wayne and Sparks Bobbie Niel
Create a Home Valuation Report for This Property
The Home Valuation Report is an in-depth analysis detailing your home's value as well as a comparison with similar homes in the area
Home Values in the Area
Average Home Value in this Area
Purchase History
| Date | Buyer | Sale Price | Title Company |
|---|---|---|---|
| Smotherman John B | -- | Attorney | |
| Smotherman John B | $129,000 | -- | |
| Sparks Virgil M | $82,000 | -- | |
| Sparks Virgil M | $82,000 | -- | |
| Sparks Larry Wayne | -- | -- |
Source: Public Records
Mortgage History
| Date | Status | Borrower | Loan Amount |
|---|---|---|---|
| Open | Smotherman John B | $103,200 |
Source: Public Records
Tax History Compared to Growth
Tax History
| Year | Tax Paid | Tax Assessment Tax Assessment Total Assessment is a certain percentage of the fair market value that is determined by local assessors to be the total taxable value of land and additions on the property. | Land | Improvement |
|---|---|---|---|---|
| 2024 | $2,517 | $53,070 | $13,720 | $39,350 |
| 2023 | $2,517 | $53,070 | $13,720 | $39,350 |
| 2022 | $2,403 | $37,910 | $9,800 | $28,110 |
| 2021 | $2,450 | $37,910 | $9,800 | $28,110 |
| 2020 | $2,449 | $37,910 | $9,800 | $28,110 |
| 2019 | $2,441 | $33,710 | $9,800 | $23,910 |
| 2018 | $2,446 | $33,710 | $9,800 | $23,910 |
| 2017 | $2,416 | $33,300 | $9,800 | $23,500 |
| 2016 | $2,448 | $32,750 | $9,800 | $22,950 |
| 2015 | $2,566 | $32,750 | $9,800 | $22,950 |
| 2014 | $2,566 | $32,750 | $9,800 | $22,950 |
| 2012 | -- | $44,750 | $10,500 | $34,250 |
Source: Public Records
Map
Nearby Homes
- 4222 Meadowsweet Dr
- 0 Forest Ridge Blvd Unit 937866
- 5027 Katherine Ct
- 3465 Berrywood Dr
- 5224 Sweetleaf Dr
- 3532 Berrywood Dr
- 4048 Quail Bush Dr
- 4288 Dobbin Cir
- 4294 Dobbin Cir
- 2757 Amberwood Dr Unit 17-300
- 4731 Blue Spruce Ct
- 3531 Forest Ridge Blvd
- 4183 Eagle Watch Way
- 4799 Blue Spruce Ct
- 3855 Berrywood Dr
- 4416 Hawk Watch Way
- 3513 Forest Ridge Blvd
- 2520 Harshman Rd
- 2512 Harshman Rd
- 5540 Signet Dr
- 4915 Pepperwood Dr
- 4914 Sweetbirch Dr
- 4933 Pepperwood Dr
- 4907 Pepperwood Dr
- 4908 Sweetbirch Dr
- 4920 Sweetbirch Dr
- 4920 Pepperwood Dr
- 4926 Pepperwood Dr
- 4926 Sweetbirch Dr
- 4914 Pepperwood Dr
- 4939 Pepperwood Dr
- 4014 Silver Oak St
- 4000 Silver Oak St
- 4932 Pepperwood Dr
- 4908 Pepperwood Dr
- 4932 Sweetbirch Dr
- 4945 Pepperwood Dr
- 3932 Silver Oak St
- 4919 Sweetbell Ct
- 4938 Pepperwood Dr