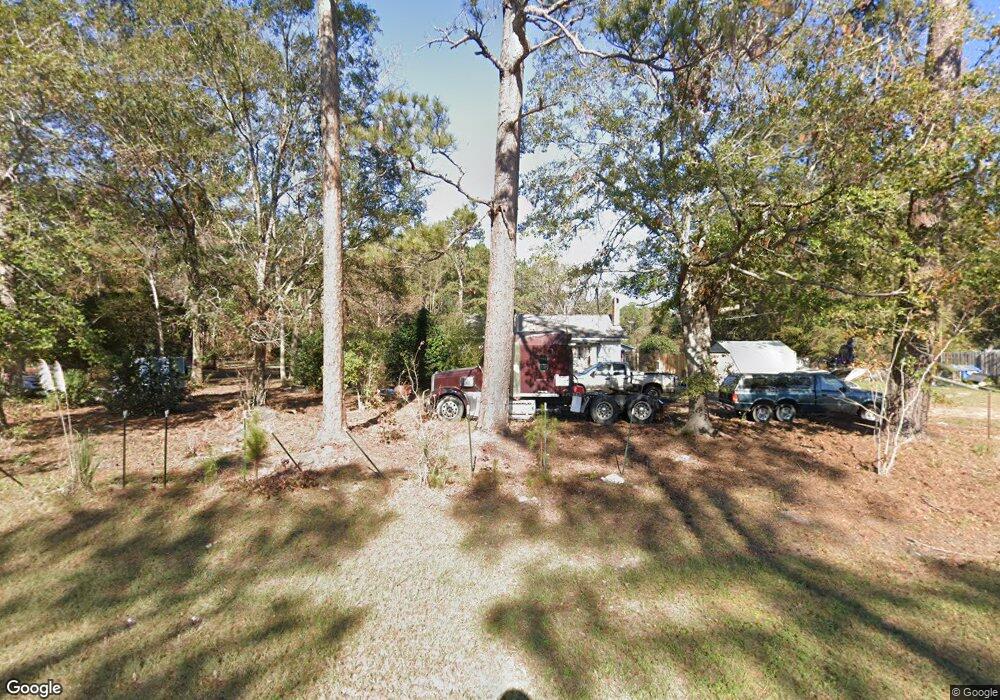
4926 Blue Jay Rd Guyton, GA 31312
Estimated Value: $218,000 - $284,000
--
Bed
1
Bath
1,831
Sq Ft
$143/Sq Ft
Est. Value
About This Home
This home is located at 4926 Blue Jay Rd, Guyton, GA 31312 and is currently estimated at $262,398, approximately $143 per square foot. 4926 Blue Jay Rd is a home located in Effingham County with nearby schools including Marlow Elementary School, South Effingham Middle School, and South Effingham High School.
Ownership History
Date
Name
Owned For
Owner Type
Purchase Details
Closed on
Nov 5, 2016
Sold by
Thomas
Bought by
Folmar Thomas and Windham Shelia
Current Estimated Value
Home Financials for this Owner
Home Financials are based on the most recent Mortgage that was taken out on this home.
Original Mortgage
$72,907
Outstanding Balance
$60,013
Interest Rate
4.25%
Mortgage Type
FHA
Estimated Equity
$202,385
Purchase Details
Closed on
Feb 27, 2007
Sold by
Hayes Connie Fetzer
Bought by
Folmar Thomas
Home Financials for this Owner
Home Financials are based on the most recent Mortgage that was taken out on this home.
Original Mortgage
$106,575
Interest Rate
6.3%
Mortgage Type
FHA
Purchase Details
Closed on
Dec 21, 2006
Sold by
Fetzer Robert E
Bought by
Powell Edwina Fetzer and Lynch Charlotte Fetzer
Purchase Details
Closed on
Dec 19, 2006
Sold by
Newton Louella F
Bought by
Fetzer Robert Edward and Fetzer James Richard
Create a Home Valuation Report for This Property
The Home Valuation Report is an in-depth analysis detailing your home's value as well as a comparison with similar homes in the area
Home Values in the Area
Average Home Value in this Area
Purchase History
| Date | Buyer | Sale Price | Title Company |
|---|---|---|---|
| Folmar Thomas | -- | -- | |
| Folmar Thomas | $108,248 | -- | |
| Powell Edwina Fetzer | -- | -- | |
| Fetzer Robert E | -- | -- | |
| Fetzer Robert Edward | -- | -- |
Source: Public Records
Mortgage History
| Date | Status | Borrower | Loan Amount |
|---|---|---|---|
| Open | Folmar Thomas | $72,907 | |
| Previous Owner | Folmar Thomas | $106,575 |
Source: Public Records
Tax History Compared to Growth
Tax History
| Year | Tax Paid | Tax Assessment Tax Assessment Total Assessment is a certain percentage of the fair market value that is determined by local assessors to be the total taxable value of land and additions on the property. | Land | Improvement |
|---|---|---|---|---|
| 2024 | $2,083 | $81,516 | $48,622 | $32,894 |
| 2023 | $1,224 | $77,026 | $48,622 | $28,405 |
| 2022 | $1,644 | $61,810 | $33,405 | $28,405 |
| 2021 | $1,592 | $58,950 | $31,514 | $27,436 |
| 2020 | $1,562 | $57,708 | $30,896 | $26,812 |
| 2019 | $1,518 | $44,481 | $17,669 | $26,812 |
| 2018 | $1,494 | $43,268 | $18,184 | $25,084 |
| 2017 | $1,501 | $43,268 | $18,184 | $25,084 |
| 2016 | $1,450 | $43,405 | $18,184 | $25,220 |
| 2015 | -- | $43,404 | $18,184 | $25,220 |
| 2014 | -- | $43,405 | $18,184 | $25,220 |
| 2013 | -- | $43,404 | $18,184 | $25,220 |
Source: Public Records
Map
Nearby Homes
- 4414 Blue Jay Rd
- 180 Royal Oak Dr
- 0 Sand Hill Rd Unit 325134
- 0 Sand Hill Rd Unit 22392317
- 111 Vintage Dr
- 141 Otter Way
- 100 Finch Ln
- 114 Carriage House Dr
- 100 Priya Ct
- 128 Watson Mill Rd
- 130 Watson Mill Rd
- 127 Watson Mill Rd
- 140 Watson Mill Rd
- 123 Watson Mill Rd
- 134 Watson Mill Rd
- 136 Watson Mill Rd
- 142 Watson Mill Rd
- 3478 Georgia 17
- 100 Concord Dr
- 117 Concord Dr
- 4908 Blue Jay Rd
- 4912 Blue Jay Rd
- 4976 Blue Jay Rd
- 4992 Blue Jay Rd
- 4652 Blue Jay Rd
- 5161 Blue Jay Rd
- 4216 Ga Highway 17 Ln S
- 4200 Ga Highway 17 S
- 4190 Ga Highway 17 Ln S
- 185 Frank W Dasher Ln
- 199 Frank W Dasher Ln
- 4366 Ga Highway 17 S
- 4366 Ga Highway 17 S
- 4440 Georgia 17
- 295 Frank W Dasher Ln
- 4224 Ga Highway 17 S
- 4455 Ga Highway 17 S
- 5280 Blue Jay Rd
- 222 Frank W Dasher Ln
- 179 Frank W Dasher Ln