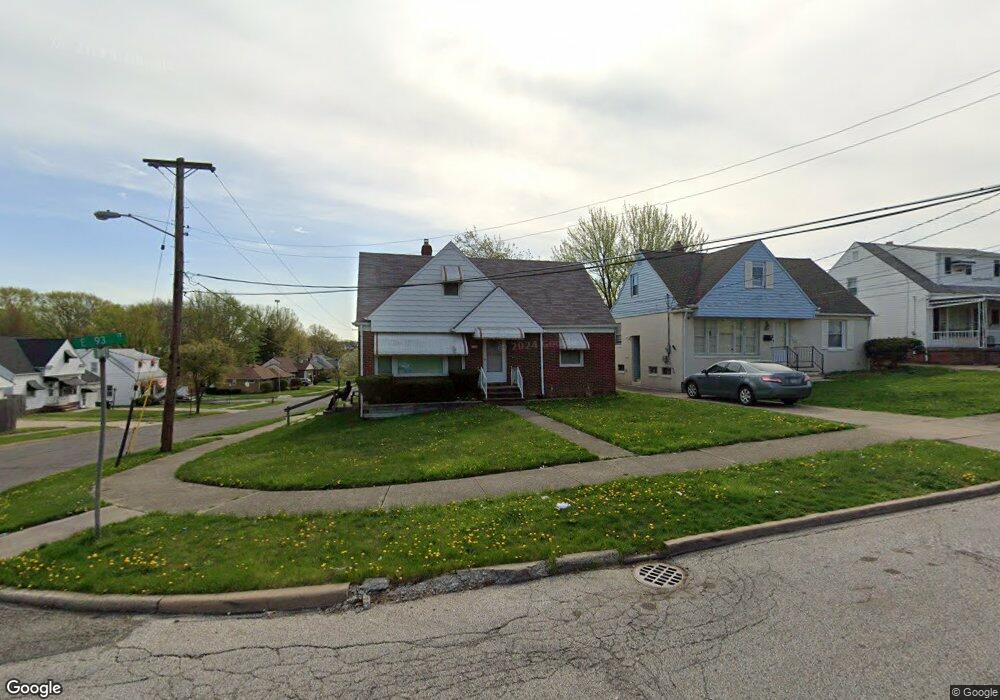
4953 E 93rd St Cleveland, OH 44125
Estimated Value: $118,043 - $162,000
3
Beds
2
Baths
1,260
Sq Ft
$111/Sq Ft
Est. Value
About This Home
This home is located at 4953 E 93rd St, Cleveland, OH 44125 and is currently estimated at $140,261, approximately $111 per square foot. 4953 E 93rd St is a home located in Cuyahoga County with nearby schools including Garfield Heights High School, North Shore High School, and Holy Name Elementary School.
Ownership History
Date
Name
Owned For
Owner Type
Purchase Details
Closed on
Mar 23, 2009
Sold by
Barnes Janice and Topougis Diane
Bought by
Barrett Harold
Current Estimated Value
Home Financials for this Owner
Home Financials are based on the most recent Mortgage that was taken out on this home.
Original Mortgage
$68,633
Interest Rate
5.22%
Mortgage Type
FHA
Purchase Details
Closed on
Aug 15, 1996
Sold by
Fazekas Larry A
Bought by
Bernhard Janice L and Bernhard Diane E
Home Financials for this Owner
Home Financials are based on the most recent Mortgage that was taken out on this home.
Original Mortgage
$72,900
Interest Rate
8.18%
Mortgage Type
New Conventional
Purchase Details
Closed on
May 28, 1986
Sold by
Clark Nancy
Bought by
Fazekas Larry A
Purchase Details
Closed on
Jul 5, 1983
Sold by
Clark Daryl G
Bought by
Nancy Clark
Purchase Details
Closed on
May 15, 1979
Sold by
Truax Harry M and Truax Olivia E
Bought by
Clark Daryl G
Purchase Details
Closed on
Jan 1, 1975
Bought by
Truax Harry M and Truax Olivia E
Create a Home Valuation Report for This Property
The Home Valuation Report is an in-depth analysis detailing your home's value as well as a comparison with similar homes in the area
Home Values in the Area
Average Home Value in this Area
Purchase History
| Date | Buyer | Sale Price | Title Company |
|---|---|---|---|
| Barrett Harold | $69,900 | Barristers Title Agency | |
| Bernhard Janice L | $81,000 | -- | |
| Fazekas Larry A | $48,000 | -- | |
| Clark Nancy | -- | -- | |
| Nancy Clark | -- | -- | |
| Clark Daryl G | $46,000 | -- | |
| Truax Harry M | -- | -- |
Source: Public Records
Mortgage History
| Date | Status | Borrower | Loan Amount |
|---|---|---|---|
| Previous Owner | Barrett Harold | $68,633 | |
| Previous Owner | Bernhard Janice L | $72,900 |
Source: Public Records
Tax History Compared to Growth
Tax History
| Year | Tax Paid | Tax Assessment Tax Assessment Total Assessment is a certain percentage of the fair market value that is determined by local assessors to be the total taxable value of land and additions on the property. | Land | Improvement |
|---|---|---|---|---|
| 2024 | $4,243 | $41,510 | $8,295 | $33,215 |
| 2023 | $2,644 | $23,250 | $4,590 | $18,660 |
| 2022 | $2,602 | $23,240 | $4,585 | $18,655 |
| 2021 | $2,746 | $23,240 | $4,590 | $18,660 |
| 2020 | $2,366 | $18,590 | $3,680 | $14,910 |
| 2019 | $2,346 | $53,100 | $10,500 | $42,600 |
| 2018 | $2,343 | $18,590 | $3,680 | $14,910 |
| 2017 | $2,363 | $17,610 | $3,470 | $14,140 |
| 2016 | $2,397 | $17,610 | $3,470 | $14,140 |
| 2015 | $2,631 | $17,610 | $3,470 | $14,140 |
| 2014 | $2,631 | $21,460 | $4,240 | $17,220 |
Source: Public Records
Map
Nearby Homes
- 4932 E 93rd St
- 4969 E 90th St
- 4977 E 90th St
- 4903 E 94th St
- 4963 E 88th St
- 9513 David Rd
- 4915 E 88th St
- 9011 Park Heights Ave
- 8827 Park Heights Ave
- 4839 E 94th St
- 9302 Park Heights Ave
- 4909 E 85th St
- 4830 E 88th St
- 9612 Park Heights Ave
- 4883 E 96th St
- 4864 E 96th St
- 4888 E 85th St
- 4815 E 86th St
- 4928 E 84th St
- 4821 E 85th St
- 4957 E 93rd St
- 4961 E 93rd St
- 9312 David Rd
- 4945 E 93rd St
- 4965 E 93rd St
- 4941 E 93rd St
- 9316 David Rd
- 9313 David Rd
- 4948 E 93rd St
- 4944 E 93rd St
- 4969 E 93rd St
- 4969 E 93rd St Unit E
- 4952 E 93rd St
- 4937 E 93rd St
- 4940 E 93rd St
- 4956 E 93rd St
- 9313 Alexander Rd
- 9317 David Rd
- 4936 E 93rd St
- 4960 E 93rd St