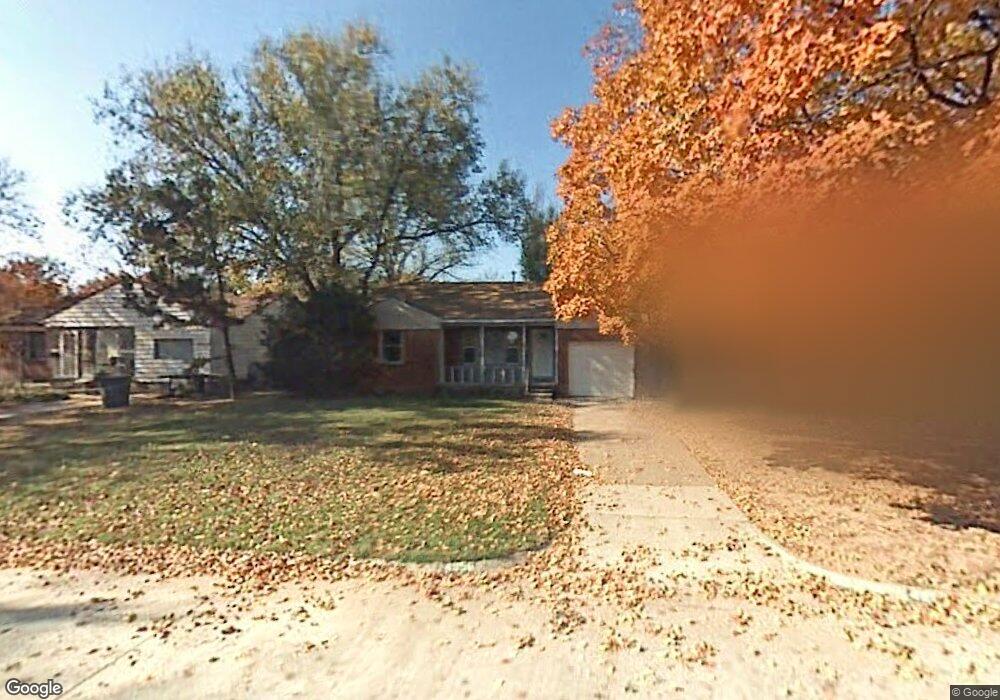
4956 S Newport Ave Tulsa, OK 74105
Brookside NeighborhoodEstimated Value: $162,000 - $190,776
2
Beds
1
Bath
1,064
Sq Ft
$164/Sq Ft
Est. Value
About This Home
This home is located at 4956 S Newport Ave, Tulsa, OK 74105 and is currently estimated at $174,694, approximately $164 per square foot. 4956 S Newport Ave is a home located in Tulsa County with nearby schools including Eliot Elementary School, Edison Preparatory School, and Thomas Edison Preparatory High School.
Ownership History
Date
Name
Owned For
Owner Type
Purchase Details
Closed on
Apr 1, 2011
Sold by
Dunn Richard and Dunn Karen
Bought by
Geyer Michele Ann
Current Estimated Value
Home Financials for this Owner
Home Financials are based on the most recent Mortgage that was taken out on this home.
Original Mortgage
$71,250
Outstanding Balance
$49,431
Interest Rate
4.92%
Mortgage Type
New Conventional
Estimated Equity
$125,263
Purchase Details
Closed on
Nov 20, 2009
Sold by
Wilson Royce and Wilson Bridget
Bought by
Dunn Living Trust
Purchase Details
Closed on
May 28, 1998
Sold by
Abbott Thompson Shirley A and Thompson Thaddyeus W
Bought by
Abbott Etoile Yvette
Purchase Details
Closed on
Dec 19, 1997
Sold by
Abbott Thompson Shirley A
Bought by
Abbott Thompson Shirley A and Abbott Stoile Yvette
Purchase Details
Closed on
Nov 3, 1997
Sold by
Thompson Thaddyeus W
Bought by
Abbott Thompson Shirley A
Purchase Details
Closed on
Mar 1, 1995
Purchase Details
Closed on
Oct 1, 1993
Purchase Details
Closed on
Aug 1, 1986
Create a Home Valuation Report for This Property
The Home Valuation Report is an in-depth analysis detailing your home's value as well as a comparison with similar homes in the area
Home Values in the Area
Average Home Value in this Area
Purchase History
| Date | Buyer | Sale Price | Title Company |
|---|---|---|---|
| Geyer Michele Ann | $75,000 | None Available | |
| Dunn Living Trust | -- | None Available | |
| Wilson Royce | $76,157 | None Available | |
| Abbott Etoile Yvette | -- | -- | |
| Abbott Thompson Shirley A | -- | -- | |
| Abbott Thompson Shirley A | -- | -- | |
| -- | $45,500 | -- | |
| -- | $44,000 | -- | |
| -- | $43,000 | -- |
Source: Public Records
Mortgage History
| Date | Status | Borrower | Loan Amount |
|---|---|---|---|
| Open | Geyer Michele Ann | $71,250 | |
| Closed | Wilson Royce | $0 |
Source: Public Records
Tax History Compared to Growth
Tax History
| Year | Tax Paid | Tax Assessment Tax Assessment Total Assessment is a certain percentage of the fair market value that is determined by local assessors to be the total taxable value of land and additions on the property. | Land | Improvement |
|---|---|---|---|---|
| 2024 | $1,151 | $9,071 | $1,988 | $7,083 |
| 2023 | $1,151 | $10,072 | $2,091 | $7,981 |
| 2022 | $1,209 | $9,071 | $2,834 | $6,237 |
| 2021 | $1,198 | $9,071 | $2,834 | $6,237 |
| 2020 | $1,182 | $9,071 | $2,834 | $6,237 |
| 2019 | $1,243 | $9,071 | $2,834 | $6,237 |
| 2018 | $1,246 | $9,071 | $2,834 | $6,237 |
| 2017 | $1,243 | $10,071 | $3,146 | $6,925 |
| 2016 | $1,178 | $9,777 | $3,054 | $6,723 |
| 2015 | $1,142 | $9,493 | $3,300 | $6,193 |
| 2014 | $1,131 | $9,493 | $3,300 | $6,193 |
Source: Public Records
Map
Nearby Homes
- 4918 S Madison Ave
- 1136 E 49th St
- 5121 S Madison Ave
- 4828 S Madison Ave
- 4824 S Owasso Ave
- 4949 S Boston Place
- 1025 E 53rd St
- 4954 S Boston Place
- 1062 E 53rd St
- 1119 E 53rd Place
- 1123 E 53rd Place
- 4944 S Quincy Ave
- 4745 S Boston Place
- 41 E 52nd St
- 4703 S Detroit Ave
- 4641 S Detroit Ave
- 1416 E 50th St
- 4822 S Quaker Ave
- 1414 E 52nd St
- 1313 E 48th St Unit 14
- 4952 S Newport Ave
- 4962 S Newport Ave
- 4955 S Norfolk Ave
- 4966 S Newport Ave
- 4951 S Norfolk Ave
- 4961 S Norfolk Ave
- 4945 S Norfolk Ave
- 4965 S Norfolk Ave
- 4942 S Newport Ave
- 4972 S Newport Ave
- 4941 S Norfolk Ave
- 4971 S Norfolk Ave
- 4936 S Newport Ave
- 4976 S Newport Ave
- 4941 S Newport Ave
- 4935 S Norfolk Ave
- 4975 S Norfolk Ave
- 4958 S Norfolk Ave
- 4952 S Norfolk Ave
- 4932 S Newport Ave