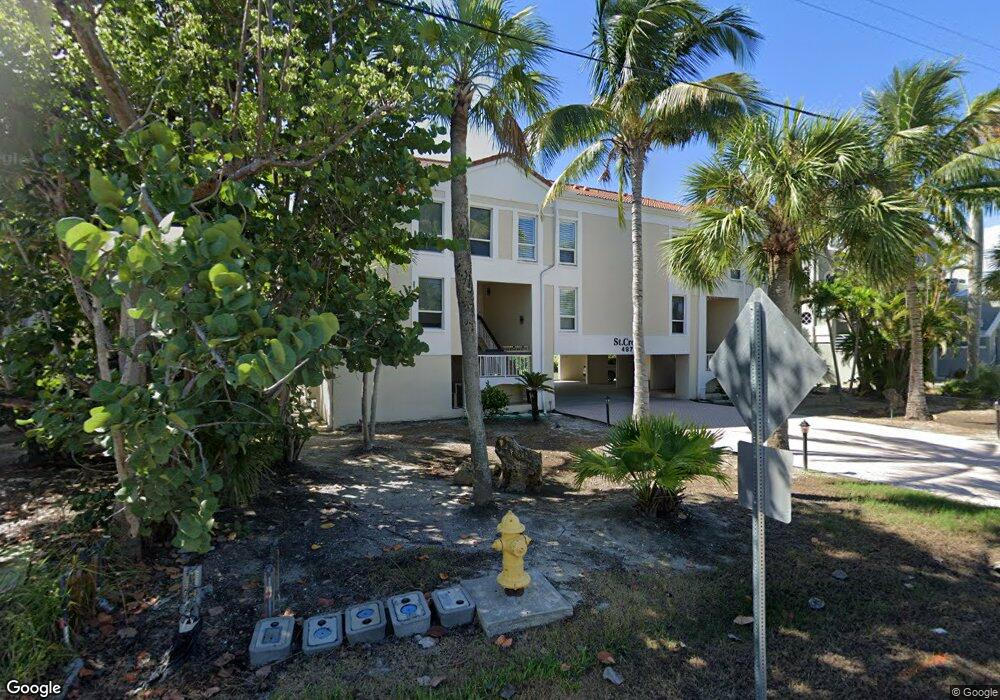
497 E Gulf Dr Unit 2 Sanibel, FL 33957
Estimated Value: $778,000 - $1,343,000
2
Beds
3
Baths
1,896
Sq Ft
$524/Sq Ft
Est. Value
About This Home
This home is located at 497 E Gulf Dr Unit 2, Sanibel, FL 33957 and is currently estimated at $993,316, approximately $523 per square foot. 497 E Gulf Dr Unit 2 is a home located in Lee County with nearby schools including Sanibel Elementary School, Cypress Lake Middle School, and Cypress Lake High School.
Ownership History
Date
Name
Owned For
Owner Type
Purchase Details
Closed on
Sep 15, 2011
Sold by
Steves Daniel R and Steves Rebecca J
Bought by
Steves Daniel R and Steves Rebecca J
Current Estimated Value
Home Financials for this Owner
Home Financials are based on the most recent Mortgage that was taken out on this home.
Original Mortgage
$257,500
Outstanding Balance
$177,320
Interest Rate
4.53%
Mortgage Type
New Conventional
Estimated Equity
$815,996
Purchase Details
Closed on
Jul 30, 2011
Sold by
Steves Daniel R and Steves Rebecca J
Bought by
Steves Daniel R and Steves Rebecca J
Home Financials for this Owner
Home Financials are based on the most recent Mortgage that was taken out on this home.
Original Mortgage
$257,500
Outstanding Balance
$177,320
Interest Rate
4.53%
Mortgage Type
New Conventional
Estimated Equity
$815,996
Purchase Details
Closed on
Jul 14, 1997
Sold by
Steves Daniel and Steves Rebecca
Bought by
Steves Daniel R
Create a Home Valuation Report for This Property
The Home Valuation Report is an in-depth analysis detailing your home's value as well as a comparison with similar homes in the area
Home Values in the Area
Average Home Value in this Area
Purchase History
| Date | Buyer | Sale Price | Title Company |
|---|---|---|---|
| Steves Daniel R | -- | None Available | |
| Steves Daniel R | -- | Naples Title Inc | |
| Steves Daniel R | -- | -- |
Source: Public Records
Mortgage History
| Date | Status | Borrower | Loan Amount |
|---|---|---|---|
| Open | Steves Daniel R | $257,500 |
Source: Public Records
Tax History Compared to Growth
Tax History
| Year | Tax Paid | Tax Assessment Tax Assessment Total Assessment is a certain percentage of the fair market value that is determined by local assessors to be the total taxable value of land and additions on the property. | Land | Improvement |
|---|---|---|---|---|
| 2025 | $6,435 | $461,643 | -- | -- |
| 2024 | $13,370 | $448,633 | -- | -- |
| 2023 | $13,370 | $893,953 | $0 | $893,953 |
| 2022 | $5,800 | $422,880 | $0 | $0 |
| 2021 | $5,816 | $969,648 | $0 | $969,648 |
| 2020 | $5,775 | $404,894 | $0 | $0 |
| 2019 | $5,666 | $395,791 | $0 | $0 |
| 2018 | $5,660 | $388,411 | $0 | $0 |
| 2017 | $5,654 | $380,422 | $0 | $0 |
| 2016 | $5,618 | $884,410 | $0 | $884,410 |
| 2015 | $5,714 | $873,500 | $0 | $873,500 |
| 2014 | -- | $724,600 | $0 | $724,600 |
| 2013 | -- | $363,600 | $0 | $363,600 |
Source: Public Records
Map
Nearby Homes
- 519 Kinzie Island Ct
- 500 Kinzie Island Ct
- 497 E Gulf Dr Unit 4
- 503 E Gulf Dr Unit A
- 931 S Yachtsman Dr
- 527 E Gulf Dr Unit 204
- 527 E Gulf Dr Unit 203
- 429 E Gulf Dr Unit C-54
- 411 Bella Vista Way E
- 409 E Gulf Dr Unit C18
- 404 E Gulf Dr Unit 6
- 404 E Gulf Dr
- 1105 Skiff Place
- 1113 Skiff Place
- 561 Periwinkle Way Unit E2
- 1062 S Yachtsman Dr
- 601 Periwinkle Way Unit D5
- 601 Periwinkle Way Unit D1
- 497 E Gulf Dr Unit 1
- 497 E Gulf Dr Unit 3
- 487 E Gulf Dr Unit 487
- 503 E Gulf Dr Unit B
- 501 E Gulf Dr Unit A
- 533 Kinzie Island Ct
- 483 E Gulf Dr
- 485 E Gulf Dr
- 519 Kinzie Island Ct Unit 6
- 547 Kinzie Island Ct
- 527 E Gulf Dr Unit 105
- 527 E Gulf Dr Unit 102
- 527 E Gulf Dr Unit 207
- 527 E Gulf Dr Unit 107
- 527 E Gulf Dr Unit 201
- 527 E Gulf Dr Unit 104
- 527 E Gulf Dr Unit 206
- 527 E Gulf Dr Unit 205
- 527 E Gulf Dr Unit 202
- 527 E Gulf Dr Unit 101