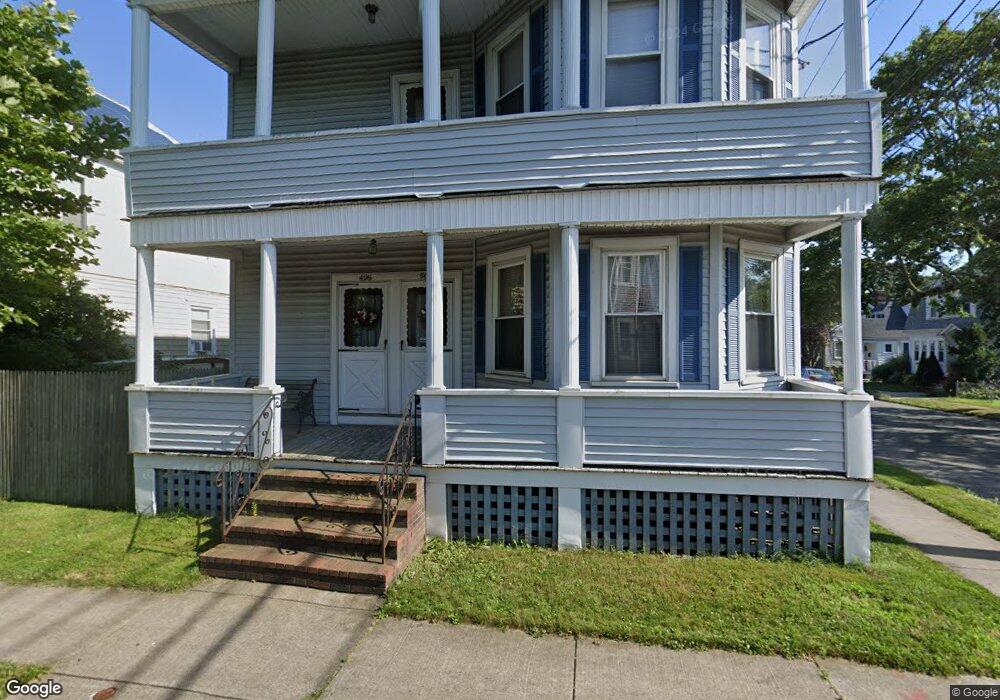
498 Allen St Unit 500 New Bedford, MA 02740
The South End NeighborhoodEstimated Value: $498,000 - $660,000
6
Beds
2
Baths
2,630
Sq Ft
$210/Sq Ft
Est. Value
About This Home
This home is located at 498 Allen St Unit 500, New Bedford, MA 02740 and is currently estimated at $552,771, approximately $210 per square foot. 498 Allen St Unit 500 is a home located in Bristol County with nearby schools including Betsey B. Winslow Elementary School, Keith Middle School, and New Bedford High School.
Ownership History
Date
Name
Owned For
Owner Type
Purchase Details
Closed on
Dec 24, 2024
Sold by
Cohen Sheila Est and Gallant
Bought by
Mejia Henry P and Mejia Melvin P
Current Estimated Value
Home Financials for this Owner
Home Financials are based on the most recent Mortgage that was taken out on this home.
Original Mortgage
$450,000
Outstanding Balance
$446,056
Interest Rate
6.79%
Mortgage Type
Purchase Money Mortgage
Estimated Equity
$106,715
Purchase Details
Closed on
Oct 3, 2024
Sold by
Cohen Sheila B Est and Gallant
Bought by
New Bedford Jewish Conval
Purchase Details
Closed on
Jul 22, 2009
Sold by
Sheila Cohen Lt and Cohen Sheila
Bought by
Cohen Sheila
Create a Home Valuation Report for This Property
The Home Valuation Report is an in-depth analysis detailing your home's value as well as a comparison with similar homes in the area
Home Values in the Area
Average Home Value in this Area
Purchase History
| Date | Buyer | Sale Price | Title Company |
|---|---|---|---|
| Mejia Henry P | $500,000 | None Available | |
| Mejia Henry P | $500,000 | None Available | |
| New Bedford Jewish Conval | -- | None Available | |
| New Bedford Jewish Conval | -- | None Available | |
| Cohen Sheila | -- | -- | |
| Cohen Sheila | -- | -- |
Source: Public Records
Mortgage History
| Date | Status | Borrower | Loan Amount |
|---|---|---|---|
| Open | Mejia Henry P | $450,000 | |
| Closed | Mejia Henry P | $450,000 |
Source: Public Records
Tax History Compared to Growth
Tax History
| Year | Tax Paid | Tax Assessment Tax Assessment Total Assessment is a certain percentage of the fair market value that is determined by local assessors to be the total taxable value of land and additions on the property. | Land | Improvement |
|---|---|---|---|---|
| 2025 | $5,237 | $463,000 | $102,700 | $360,300 |
| 2024 | $4,685 | $390,400 | $104,400 | $286,000 |
| 2023 | $4,397 | $307,700 | $90,000 | $217,700 |
| 2022 | $4,054 | $260,900 | $85,600 | $175,300 |
| 2021 | $4,067 | $260,900 | $85,600 | $175,300 |
| 2020 | $4,116 | $254,700 | $85,600 | $169,100 |
| 2019 | $4,030 | $244,700 | $85,600 | $159,100 |
| 2018 | $3,863 | $232,300 | $85,600 | $146,700 |
| 2017 | $3,548 | $212,600 | $85,600 | $127,000 |
| 2016 | $3,423 | $207,600 | $85,600 | $122,000 |
| 2015 | $3,207 | $203,900 | $85,600 | $118,300 |
| 2014 | $3,020 | $199,200 | $80,400 | $118,800 |
Source: Public Records
Map
Nearby Homes
- 494 Allen St
- 14 Brownell St
- 490 Allen St Unit 492
- 24-26 Brownell St
- 512 Allen St
- 24 Brownell St Unit 26
- 10 Brownell St
- 15 Brownell St
- 484 Allen St
- 4 Brownell St
- 485 Allen St
- 28 Brownell St Unit 30
- 487 Allen St
- 9 Brownell St
- 30 Brownell St Unit 2
- 516 Allen St
- 2 Brownell St
- 520 Allen St
- 193 Grape St
- 3 Brownell St