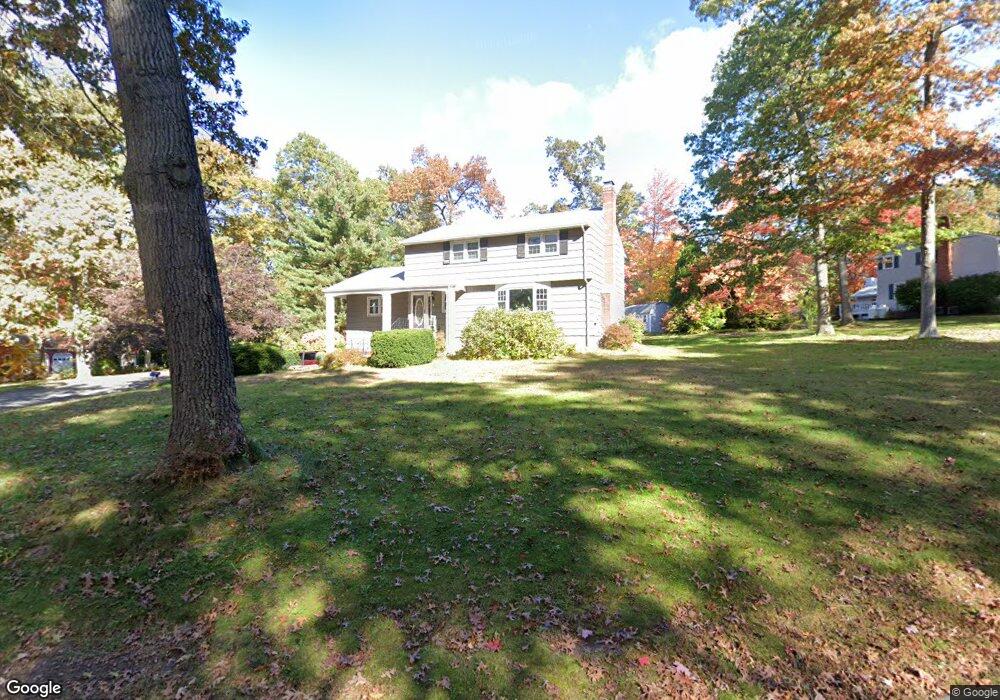
5 Forestview Dr Vernon Rockville, CT 06066
North Vernon NeighborhoodEstimated Value: $422,160 - $486,000
4
Beds
3
Baths
2,186
Sq Ft
$206/Sq Ft
Est. Value
About This Home
This home is located at 5 Forestview Dr, Vernon Rockville, CT 06066 and is currently estimated at $450,540, approximately $206 per square foot. 5 Forestview Dr is a home located in Tolland County with nearby schools including Center Road School, Vernon Center Middle School, and Rockville High School.
Ownership History
Date
Name
Owned For
Owner Type
Purchase Details
Closed on
Jun 26, 2002
Sold by
Celebration Homes Llc
Bought by
Liss Andrea
Current Estimated Value
Home Financials for this Owner
Home Financials are based on the most recent Mortgage that was taken out on this home.
Original Mortgage
$228,600
Interest Rate
6.92%
Purchase Details
Closed on
Jul 27, 1998
Sold by
Tinnirello Michael and Tinnirello Laurie
Bought by
Weaver Lester and Weaver Donna
Home Financials for this Owner
Home Financials are based on the most recent Mortgage that was taken out on this home.
Original Mortgage
$157,431
Interest Rate
6.99%
Mortgage Type
Unknown
Purchase Details
Closed on
Oct 17, 1991
Sold by
Scott Stephen and Scott Debra
Bought by
Tinnirello Michael and Tinnirello Laurie
Purchase Details
Closed on
May 25, 1990
Sold by
Joslin C Susan
Bought by
Scott Stephen
Create a Home Valuation Report for This Property
The Home Valuation Report is an in-depth analysis detailing your home's value as well as a comparison with similar homes in the area
Home Values in the Area
Average Home Value in this Area
Purchase History
| Date | Buyer | Sale Price | Title Company |
|---|---|---|---|
| Liss Andrea | $287,371 | -- | |
| Celebration Homes Llc | $30,000 | -- | |
| Weaver Lester | $162,300 | -- | |
| Tinnirello Michael | $167,900 | -- | |
| Scott Stephen | $172,500 | -- |
Source: Public Records
Mortgage History
| Date | Status | Borrower | Loan Amount |
|---|---|---|---|
| Closed | Scott Stephen | $240,000 | |
| Closed | Scott Stephen | $228,600 | |
| Previous Owner | Scott Stephen | $157,431 |
Source: Public Records
Tax History Compared to Growth
Tax History
| Year | Tax Paid | Tax Assessment Tax Assessment Total Assessment is a certain percentage of the fair market value that is determined by local assessors to be the total taxable value of land and additions on the property. | Land | Improvement |
|---|---|---|---|---|
| 2025 | $6,587 | $182,510 | $45,100 | $137,410 |
| 2024 | $6,404 | $182,510 | $45,100 | $137,410 |
| 2023 | $6,094 | $182,510 | $45,100 | $137,410 |
| 2022 | $6,094 | $182,510 | $45,100 | $137,410 |
| 2021 | $6,026 | $152,060 | $43,970 | $108,090 |
| 2020 | $6,026 | $152,060 | $43,970 | $108,090 |
| 2019 | $6,026 | $152,060 | $43,970 | $108,090 |
| 2018 | $6,026 | $152,060 | $43,970 | $108,090 |
| 2017 | $5,886 | $152,060 | $43,970 | $108,090 |
| 2016 | $6,251 | $164,380 | $49,770 | $114,610 |
| 2015 | $6,251 | $164,380 | $49,770 | $114,610 |
| 2014 | $5,936 | $164,380 | $49,770 | $114,610 |
Source: Public Records
Map
Nearby Homes
- 242 Talcottville Rd Unit 105
- 33 Sunset Terrace
- 119 Trout Stream Dr
- 61 Tankerhoosen Rd
- 53 Winding Brook Trail
- 343 Merline Rd
- 171 Center Rd
- 989 Hartford Turnpike
- 77 Center Rd
- 8 Summit Rd
- 25 Oakview Place
- 20 Whitney Ferguson Rd Unit 18
- 325 Kelly Rd
- 29 Shady Brook Ln Unit 29
- 721 Dart Hill Rd
- 1 Laurelwood Ln Unit LOT 18
- 229 Phoenix St
- 565 Talcottville Rd Unit 1C4
- 201 Regan Rd Unit 2B
- 4 Loveland Hill Rd Unit C4