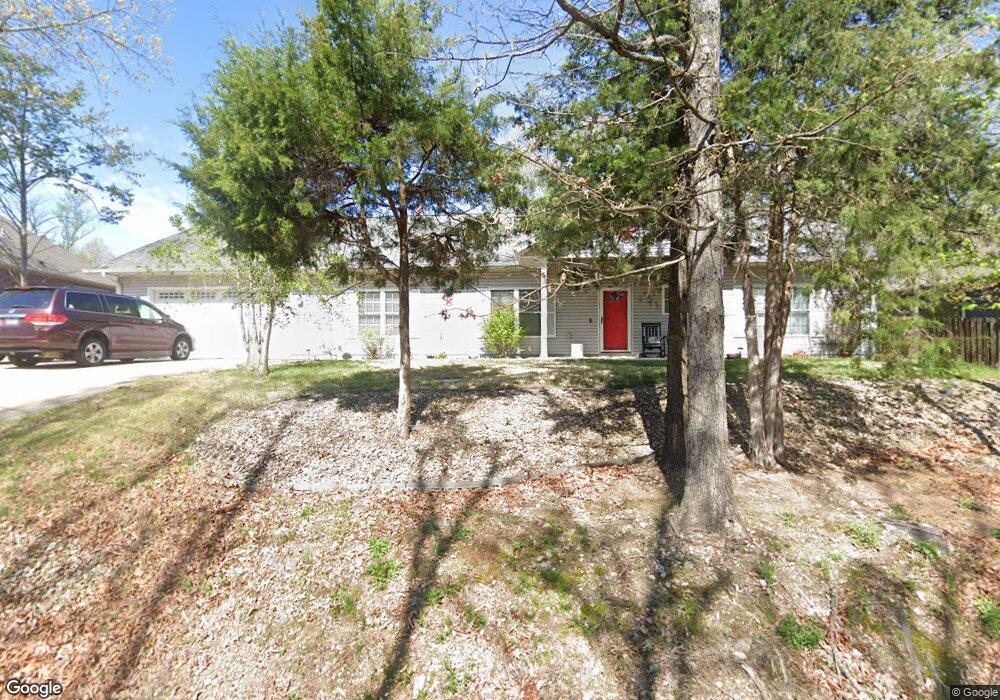
5 Harrington Dr Bella Vista, AR 72714
Estimated Value: $415,286 - $441,000
--
Bed
--
Bath
2,240
Sq Ft
$192/Sq Ft
Est. Value
About This Home
This home is located at 5 Harrington Dr, Bella Vista, AR 72714 and is currently estimated at $430,822, approximately $192 per square foot. 5 Harrington Dr is a home located in Benton County with nearby schools including Cooper Elementary School, Ruth Barker Middle School, and Washington Junior High School.
Ownership History
Date
Name
Owned For
Owner Type
Purchase Details
Closed on
Sep 30, 2025
Sold by
Tallman John Patrick
Bought by
John Tallman Revocable Trust and Tallman
Current Estimated Value
Purchase Details
Closed on
Jan 6, 2020
Sold by
Rayburn James E and Rayburn Gina L
Bought by
Tallman John Patrick and Tallman Kathy Jane
Home Financials for this Owner
Home Financials are based on the most recent Mortgage that was taken out on this home.
Original Mortgage
$187,895
Interest Rate
3.74%
Mortgage Type
New Conventional
Purchase Details
Closed on
Mar 29, 2013
Sold by
Taylor Gary S and Taylor Terri
Bought by
Rayburn James E and Rayburn Gina L
Purchase Details
Closed on
Oct 7, 2003
Bought by
Taylor
Purchase Details
Closed on
Aug 25, 2003
Bought by
Taylor
Purchase Details
Closed on
Sep 11, 1987
Bought by
Jackson
Purchase Details
Closed on
Jun 29, 1987
Bought by
Jackson
Purchase Details
Closed on
Feb 1, 1979
Bought by
Di
Create a Home Valuation Report for This Property
The Home Valuation Report is an in-depth analysis detailing your home's value as well as a comparison with similar homes in the area
Home Values in the Area
Average Home Value in this Area
Purchase History
| Date | Buyer | Sale Price | Title Company |
|---|---|---|---|
| John Tallman Revocable Trust | -- | None Listed On Document | |
| Tallman John Patrick | $235,000 | Liberty Title & Escrow Co | |
| Rayburn James E | $7,000 | Pci Advance Title Llc | |
| Taylor | -- | -- | |
| Taylor | -- | -- | |
| Jackson | -- | -- | |
| Jackson | -- | -- | |
| Di | $6,000 | -- |
Source: Public Records
Mortgage History
| Date | Status | Borrower | Loan Amount |
|---|---|---|---|
| Previous Owner | Tallman John Patrick | $187,895 |
Source: Public Records
Tax History Compared to Growth
Tax History
| Year | Tax Paid | Tax Assessment Tax Assessment Total Assessment is a certain percentage of the fair market value that is determined by local assessors to be the total taxable value of land and additions on the property. | Land | Improvement |
|---|---|---|---|---|
| 2025 | $3,100 | $74,020 | $1,600 | $72,420 |
| 2024 | $3,069 | $74,020 | $1,600 | $72,420 |
| 2023 | $3,069 | $50,060 | $800 | $49,260 |
| 2022 | $2,792 | $50,060 | $800 | $49,260 |
| 2021 | $2,785 | $50,060 | $800 | $49,260 |
| 2020 | $1,791 | $34,000 | $600 | $33,400 |
| 2019 | $1,791 | $34,000 | $600 | $33,400 |
| 2018 | $1,816 | $34,000 | $600 | $33,400 |
| 2017 | $1,734 | $34,000 | $600 | $33,400 |
| 2016 | $1,734 | $34,000 | $600 | $33,400 |
| 2015 | $2,024 | $33,570 | $1,000 | $32,570 |
| 2014 | $60 | $1,000 | $1,000 | $0 |
Source: Public Records
Map
Nearby Homes
- 4 Beckfoot Ln
- 1 Lynn Ln
- 22 Dillow Cir
- Lots 2&3 Flory Ln
- 17 Duxford Cir
- 14 Constance Cir
- 10 Dillow Ln
- 67 Fairway Dr
- 6 Carole Rae Ln
- Lot 14 Melanie Dr
- 0 Damerham Ln
- 20 Melanie Cir
- 41 Melanie Dr
- 6 Chippenham Ln
- Lot 9 Embleton Dr
- 7 Wrongton Dr
- Lot 15 Aylsham Ln
- 9 Lunsford Ln
- 13 Berkshire Dr
- 0 Modbury Cir
- L4 And L5 Harrington Dr
- 5 Harrington Dr
- 7 Harrington Dr
- 3 Harrington Dr
- 4 Harrington Dr
- 9 Harrington Dr
- 4 Harrington Dr
- 1 Harrington Dr
- 10 Harrington Dr
- 2 Harrington Dr
- 16 Rasen Ln
- 12 Rasen Ln
- 2 Harrington Dr
- 11 Harrington Dr
- 10 Harrington Dr
- 10 Harrington Dr
- 10 Harrington Dr
- 10 Harrington Dr
- 3 Harrington Cir
- 12 Harrington Dr