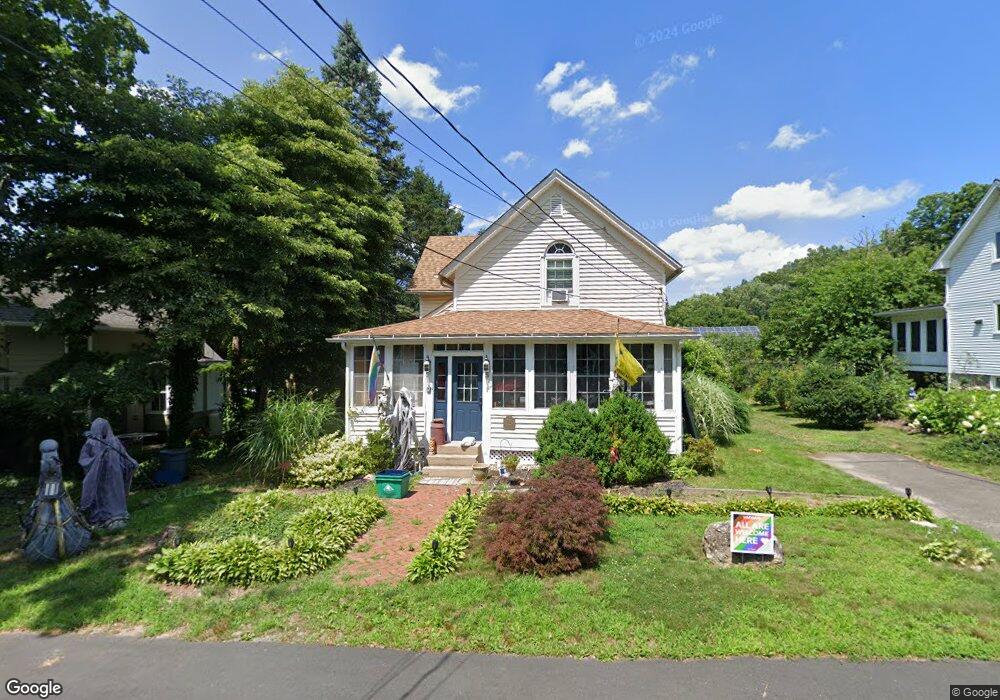
5 Lake Ave Higganum, CT 06441
Estimated Value: $306,728 - $405,000
3
Beds
2
Baths
1,113
Sq Ft
$323/Sq Ft
Est. Value
About This Home
This home is located at 5 Lake Ave, Higganum, CT 06441 and is currently estimated at $359,682, approximately $323 per square foot. 5 Lake Ave is a home located in Middlesex County with nearby schools including Haddam-Killingworth High School.
Ownership History
Date
Name
Owned For
Owner Type
Purchase Details
Closed on
Jul 17, 2008
Sold by
Myers Toni C
Bought by
Duch Kara L and Duch Gregory S
Current Estimated Value
Home Financials for this Owner
Home Financials are based on the most recent Mortgage that was taken out on this home.
Original Mortgage
$238,017
Interest Rate
6.17%
Purchase Details
Closed on
Feb 6, 2007
Sold by
Dantonio Susan D and Dantonio John J
Bought by
Myers Toni C
Home Financials for this Owner
Home Financials are based on the most recent Mortgage that was taken out on this home.
Original Mortgage
$110,000
Interest Rate
6.16%
Purchase Details
Closed on
Dec 27, 2001
Sold by
Piche Marianne
Bought by
Dantonio John J and Dantonio Susan D
Purchase Details
Closed on
Jun 1, 1998
Sold by
Merritt Priscilla A
Bought by
Poole Christopher L and Piche Marianne
Purchase Details
Closed on
Jun 11, 1987
Sold by
Stephens Mark W
Bought by
Wang Louis
Create a Home Valuation Report for This Property
The Home Valuation Report is an in-depth analysis detailing your home's value as well as a comparison with similar homes in the area
Home Values in the Area
Average Home Value in this Area
Purchase History
| Date | Buyer | Sale Price | Title Company |
|---|---|---|---|
| Duch Kara L | $240,000 | -- | |
| Myers Toni C | $259,900 | -- | |
| Dantonio John J | $137,000 | -- | |
| Poole Christopher L | $98,900 | -- | |
| Wang Louis | $136,000 | -- |
Source: Public Records
Mortgage History
| Date | Status | Borrower | Loan Amount |
|---|---|---|---|
| Open | Wang Louis | $234,476 | |
| Closed | Wang Louis | $238,017 | |
| Previous Owner | Wang Louis | $110,000 |
Source: Public Records
Tax History Compared to Growth
Tax History
| Year | Tax Paid | Tax Assessment Tax Assessment Total Assessment is a certain percentage of the fair market value that is determined by local assessors to be the total taxable value of land and additions on the property. | Land | Improvement |
|---|---|---|---|---|
| 2025 | $4,288 | $124,820 | $54,190 | $70,630 |
| 2024 | $4,288 | $124,820 | $54,190 | $70,630 |
| 2023 | $4,228 | $124,820 | $54,190 | $70,630 |
| 2022 | $4,035 | $124,820 | $54,190 | $70,630 |
| 2021 | $4,633 | $124,820 | $54,190 | $70,630 |
| 2020 | $7,704 | $119,680 | $45,330 | $74,350 |
| 2019 | $3,793 | $119,680 | $45,330 | $74,350 |
| 2018 | $3,793 | $119,680 | $45,330 | $74,350 |
| 2017 | $3,793 | $119,680 | $45,330 | $74,350 |
| 2016 | $3,734 | $119,680 | $45,330 | $74,350 |
| 2015 | $3,734 | $119,680 | $45,330 | $74,350 |
| 2014 | $3,697 | $119,680 | $45,330 | $74,350 |
Source: Public Records
Map
Nearby Homes
- 32 Maple Ave W
- 86 Christian Hill Rd
- 0 Walkley Hill Rd Unit 24088136
- 16 Walkley Hill Rd
- 0 S Dish Mill Rd Unit 24082788
- 0 Parmelee Rd
- 25 Island Dock Rd
- 0 Saybrook Rd
- 195 Injun Hollow Rd
- 291 Injun Hollow Rd
- 195A Injun Hollow Rd
- 50 Haddam Neck Rd
- 0 Mountain Laurel Dr
- 291 Hog Hill Rd
- 120 Chamberlain Hill Rd
- 215 Chamberlain Hill Rd
- 521 Foot Hills Rd
- 279 Pokorny Rd
- 209 Wiese Albert Rd
- 523 Chamberlain Hill Rd