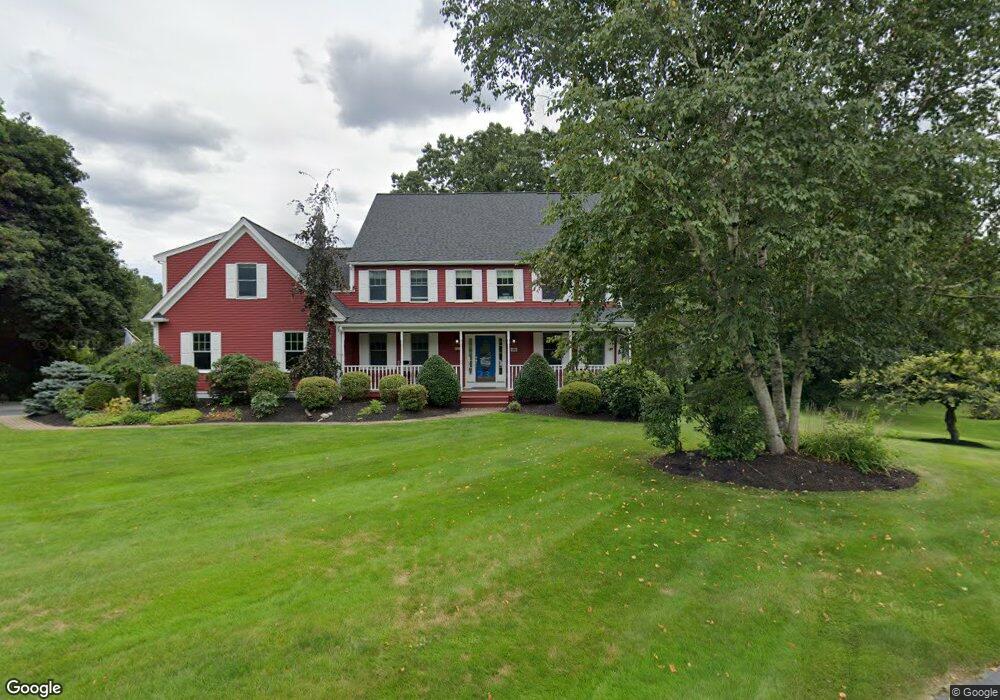
5 Oak Meadow Dr Northborough, MA 01532
Estimated Value: $1,058,742 - $1,226,000
4
Beds
3
Baths
3,263
Sq Ft
$351/Sq Ft
Est. Value
About This Home
This home is located at 5 Oak Meadow Dr, Northborough, MA 01532 and is currently estimated at $1,145,936, approximately $351 per square foot. 5 Oak Meadow Dr is a home located in Worcester County with nearby schools including Lincoln Street Elementary School, Robert E. Melican Middle School, and Algonquin Regional High School.
Ownership History
Date
Name
Owned For
Owner Type
Purchase Details
Closed on
Nov 7, 2003
Sold by
Oak Meadow Dr Rt and Goehle Linda A
Bought by
Koch John B and Koch Kristi Griffith
Current Estimated Value
Purchase Details
Closed on
Jun 17, 1994
Sold by
Oak Meadow Rt and Black Jeanne
Bought by
Goehle Robert and Goehle Linda
Create a Home Valuation Report for This Property
The Home Valuation Report is an in-depth analysis detailing your home's value as well as a comparison with similar homes in the area
Home Values in the Area
Average Home Value in this Area
Purchase History
| Date | Buyer | Sale Price | Title Company |
|---|---|---|---|
| Koch John B | $620,000 | -- | |
| Goehle Robert | $337,850 | -- |
Source: Public Records
Mortgage History
| Date | Status | Borrower | Loan Amount |
|---|---|---|---|
| Open | Goehle Robert | $402,000 | |
| Closed | Goehle Robert | $417,000 | |
| Closed | Goehle Robert | $200,000 |
Source: Public Records
Tax History Compared to Growth
Tax History
| Year | Tax Paid | Tax Assessment Tax Assessment Total Assessment is a certain percentage of the fair market value that is determined by local assessors to be the total taxable value of land and additions on the property. | Land | Improvement |
|---|---|---|---|---|
| 2025 | $13,981 | $981,100 | $324,000 | $657,100 |
| 2024 | $12,988 | $909,500 | $267,200 | $642,300 |
| 2023 | $12,289 | $830,900 | $252,000 | $578,900 |
| 2022 | $12,222 | $741,200 | $240,000 | $501,200 |
| 2021 | $11,847 | $692,000 | $218,000 | $474,000 |
| 2020 | $11,502 | $666,800 | $166,400 | $500,400 |
| 2019 | $11,254 | $656,200 | $166,400 | $489,800 |
| 2018 | $10,870 | $625,100 | $157,600 | $467,500 |
| 2017 | $10,742 | $617,700 | $157,600 | $460,100 |
| 2016 | $10,498 | $611,400 | $154,200 | $457,200 |
| 2015 | $9,384 | $560,900 | $162,500 | $398,400 |
| 2014 | $9,629 | $580,400 | $162,500 | $417,900 |
Source: Public Records
Map
Nearby Homes