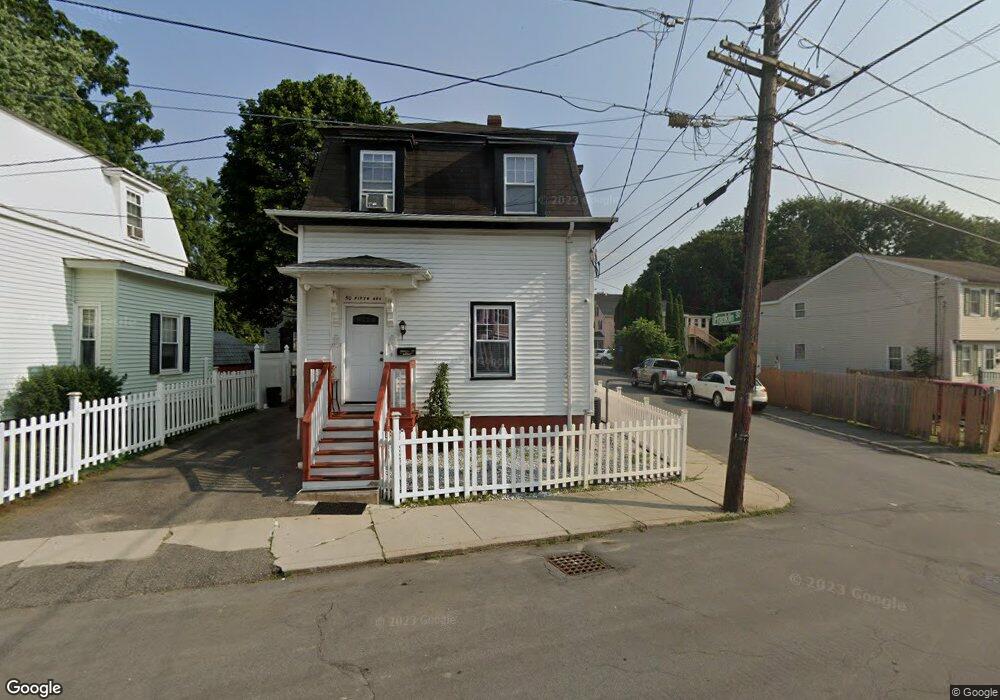
50 5th Ave Haverhill, MA 01830
Lower Acres NeighborhoodEstimated Value: $373,000 - $427,000
2
Beds
2
Baths
1,212
Sq Ft
$331/Sq Ft
Est. Value
About This Home
This home is located at 50 5th Ave, Haverhill, MA 01830 and is currently estimated at $400,774, approximately $330 per square foot. 50 5th Ave is a home located in Essex County with nearby schools including Pentucket Lake Elementary School.
Ownership History
Date
Name
Owned For
Owner Type
Purchase Details
Closed on
May 13, 2004
Sold by
Carey Timothy T
Bought by
Penalo Maria V
Current Estimated Value
Home Financials for this Owner
Home Financials are based on the most recent Mortgage that was taken out on this home.
Original Mortgage
$160,000
Interest Rate
5.47%
Mortgage Type
Purchase Money Mortgage
Purchase Details
Closed on
Sep 18, 2000
Sold by
Mcdermott Ft
Bought by
Carey Timothy T
Create a Home Valuation Report for This Property
The Home Valuation Report is an in-depth analysis detailing your home's value as well as a comparison with similar homes in the area
Home Values in the Area
Average Home Value in this Area
Purchase History
| Date | Buyer | Sale Price | Title Company |
|---|---|---|---|
| Penalo Maria V | $180,000 | -- | |
| Carey Timothy T | $66,000 | -- |
Source: Public Records
Mortgage History
| Date | Status | Borrower | Loan Amount |
|---|---|---|---|
| Open | Carey Timothy T | $176,000 | |
| Closed | Carey Timothy T | $33,000 | |
| Closed | Carey Timothy T | $160,000 | |
| Previous Owner | Carey Timothy T | $130,500 |
Source: Public Records
Tax History Compared to Growth
Tax History
| Year | Tax Paid | Tax Assessment Tax Assessment Total Assessment is a certain percentage of the fair market value that is determined by local assessors to be the total taxable value of land and additions on the property. | Land | Improvement |
|---|---|---|---|---|
| 2025 | $3,886 | $362,800 | $127,900 | $234,900 |
| 2024 | $3,656 | $343,600 | $126,600 | $217,000 |
| 2023 | $3,498 | $313,700 | $115,800 | $197,900 |
| 2022 | $3,315 | $260,600 | $105,100 | $155,500 |
| 2021 | $3,064 | $228,000 | $91,600 | $136,400 |
| 2020 | $2,973 | $218,600 | $84,800 | $133,800 |
| 2019 | $2,900 | $207,900 | $74,100 | $133,800 |
| 2018 | $2,779 | $194,900 | $70,000 | $124,900 |
| 2017 | $2,568 | $171,300 | $56,600 | $114,700 |
| 2016 | $2,571 | $167,400 | $56,600 | $110,800 |
| 2015 | $2,570 | $167,400 | $56,600 | $110,800 |
Source: Public Records
Map
Nearby Homes