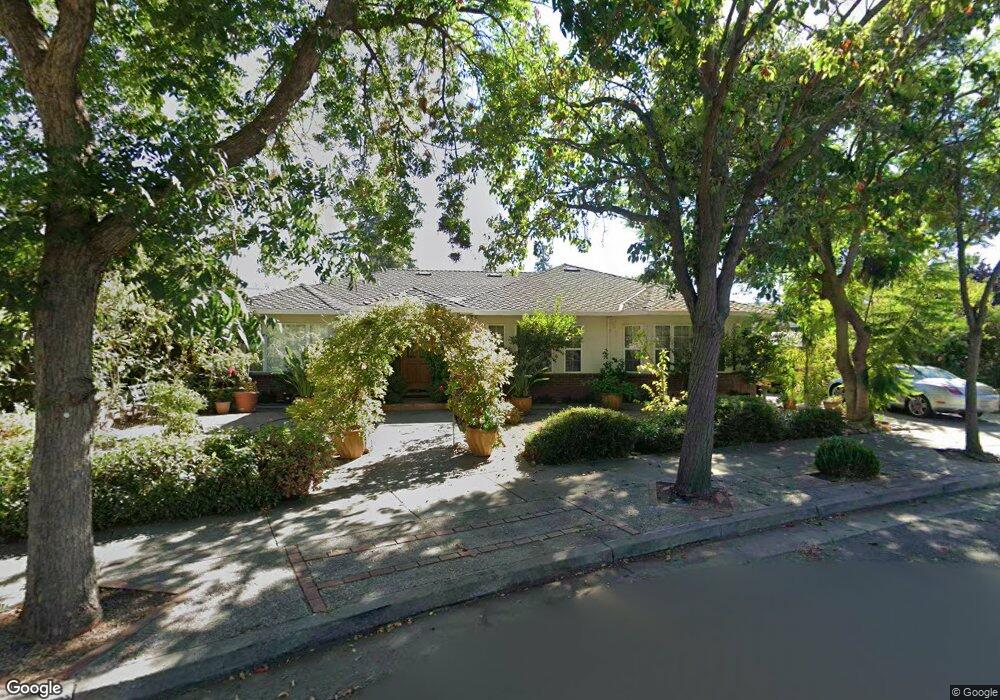
50 Catalpa Ln Campbell, CA 95008
Estimated Value: $2,015,000 - $2,453,000
3
Beds
2
Baths
2,179
Sq Ft
$1,040/Sq Ft
Est. Value
About This Home
This home is located at 50 Catalpa Ln, Campbell, CA 95008 and is currently estimated at $2,265,411, approximately $1,039 per square foot. 50 Catalpa Ln is a home located in Santa Clara County with nearby schools including Westmont High School, Campbell School of Innovation, and Capri Elementary.
Ownership History
Date
Name
Owned For
Owner Type
Purchase Details
Closed on
Oct 22, 2019
Sold by
Shakeri Michael A
Bought by
Shakeri Michael A and The Michael Shakeri Revocable
Current Estimated Value
Purchase Details
Closed on
Aug 25, 2005
Sold by
Shakeri Mike A
Bought by
Shakeri Michael A
Home Financials for this Owner
Home Financials are based on the most recent Mortgage that was taken out on this home.
Original Mortgage
$310,000
Outstanding Balance
$163,656
Interest Rate
5.64%
Mortgage Type
Credit Line Revolving
Estimated Equity
$2,101,755
Purchase Details
Closed on
Mar 11, 2003
Sold by
Shakeri Mike A and Shakeri Michael A
Bought by
Shakeri Mike A
Home Financials for this Owner
Home Financials are based on the most recent Mortgage that was taken out on this home.
Original Mortgage
$500,000
Interest Rate
5.83%
Create a Home Valuation Report for This Property
The Home Valuation Report is an in-depth analysis detailing your home's value as well as a comparison with similar homes in the area
Home Values in the Area
Average Home Value in this Area
Purchase History
| Date | Buyer | Sale Price | Title Company |
|---|---|---|---|
| Shakeri Michael A | -- | None Available | |
| Shakeri Michael A | -- | Financial Title Company | |
| Shakeri Mike A | -- | Financial Title Company |
Source: Public Records
Mortgage History
| Date | Status | Borrower | Loan Amount |
|---|---|---|---|
| Open | Shakeri Michael A | $310,000 | |
| Previous Owner | Shakeri Mike A | $500,000 |
Source: Public Records
Tax History Compared to Growth
Tax History
| Year | Tax Paid | Tax Assessment Tax Assessment Total Assessment is a certain percentage of the fair market value that is determined by local assessors to be the total taxable value of land and additions on the property. | Land | Improvement |
|---|---|---|---|---|
| 2025 | $6,165 | $448,987 | $180,356 | $268,631 |
| 2024 | $6,165 | $440,184 | $176,820 | $263,364 |
| 2023 | $6,085 | $431,553 | $173,353 | $258,200 |
| 2022 | $6,166 | $423,092 | $169,954 | $253,138 |
| 2021 | $6,040 | $414,797 | $166,622 | $248,175 |
| 2020 | $5,877 | $410,545 | $164,914 | $245,631 |
| 2019 | $5,782 | $402,496 | $161,681 | $240,815 |
| 2018 | $5,599 | $394,605 | $158,511 | $236,094 |
| 2017 | $5,507 | $386,868 | $155,403 | $231,465 |
| 2016 | $5,176 | $379,283 | $152,356 | $226,927 |
| 2015 | $5,071 | $373,587 | $150,068 | $223,519 |
| 2014 | $4,847 | $366,270 | $147,129 | $219,141 |
Source: Public Records
Map
Nearby Homes
- 63 Braxton Terrace
- 203 Wilton Dr
- 120 Kennedy Ave
- 253 W Rincon Ave
- 195 Sunnyside Ave
- 186 E Rincon Ave
- 353 W Rincon Ave Unit E
- 99 Timber Cove Dr Unit 99
- 238 Railway Ave
- 21 N 2nd St Unit 306
- 21 N 2nd St Unit 303
- 110 S 1st St Unit 110
- 26 Timber Cove Dr Unit 26
- 88 La Paz Way Unit 88
- 283 Esther Ave
- 875 Emory Ave
- 341 Carlyn Ave
- 411 Dunster Dr
- 178 Salmar Terrace
- 375 N 3rd St Unit 3
- 46 Catalpa Ln
- 70 Catalpa Ln
- 45 El Caminito Ave
- 61 El Caminito Ave
- 2265 Winchester Blvd
- 61 Catalpa Ln
- 77 El Caminito Ave
- 2265 S Winchester Blvd
- 92 Catalpa Ln
- 89 El Caminito Ave
- 53 Catalpa Ln
- 55 Catalpa Ln
- 79 Catalpa Ln
- 106 Catalpa Ln
- 103 El Caminito Ave
- 91 Catalpa Ln
- 44 El Caminito Ave
- 2295 Winchester Blvd
- 66 El Caminito Ave
- 122 Catalpa Ln