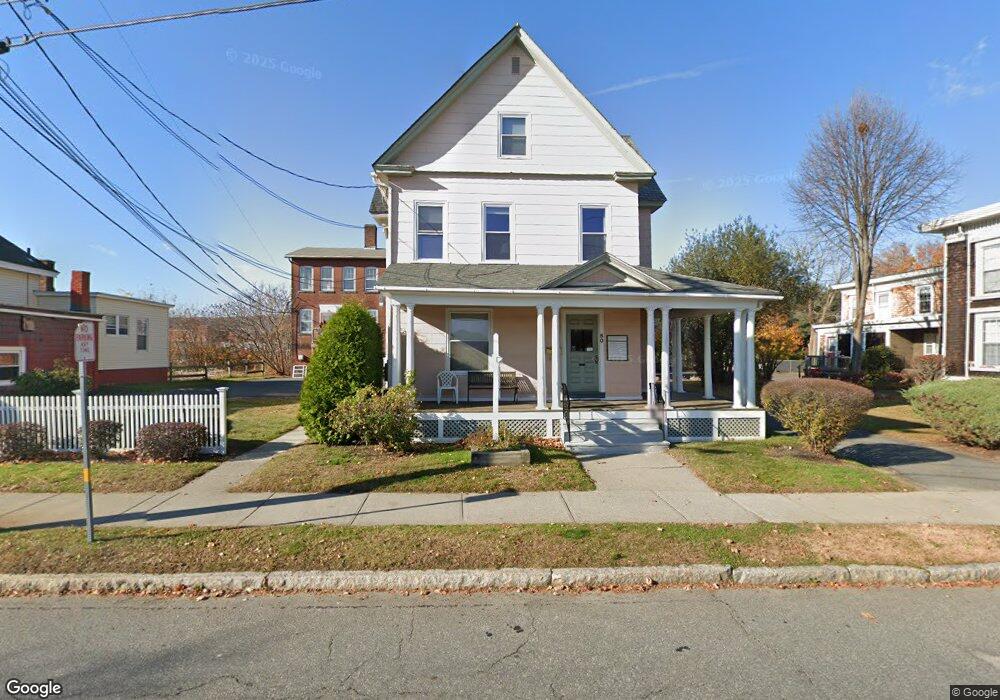
50 Chapman St Greenfield, MA 01301
4
Beds
1
Bath
2,342
Sq Ft
6,839
Sq Ft Lot
About This Home
This home is located at 50 Chapman St, Greenfield, MA 01301. 50 Chapman St is a home located in Franklin County with nearby schools including Cornerstone Christian School and Holy Trinity School.
Ownership History
Date
Name
Owned For
Owner Type
Purchase Details
Closed on
Dec 13, 2021
Sold by
In Town Self Storage Llc
Bought by
Prb Llc
Home Financials for this Owner
Home Financials are based on the most recent Mortgage that was taken out on this home.
Original Mortgage
$2,500,000
Outstanding Balance
$2,300,266
Interest Rate
3.14%
Mortgage Type
Commercial
Purchase Details
Closed on
Jan 6, 2016
Sold by
Levin Elliot S and Mangan Thomas F
Bought by
In & Town Self Storage L
Purchase Details
Closed on
Dec 31, 2015
Sold by
Mohawk Properties Llc
Bought by
Levin Elliot S and Mangan Thomas F
Create a Home Valuation Report for This Property
The Home Valuation Report is an in-depth analysis detailing your home's value as well as a comparison with similar homes in the area
Home Values in the Area
Average Home Value in this Area
Purchase History
| Date | Buyer | Sale Price | Title Company |
|---|---|---|---|
| Prb Llc | $200,000 | None Available | |
| Prb Llc | $200,000 | None Available | |
| In & Town Self Storage L | $78,750 | -- | |
| In-Town Self Storage L | $78,750 | -- | |
| Levin Elliot S | -- | -- | |
| Levin Elliot S | -- | -- |
Source: Public Records
Mortgage History
| Date | Status | Borrower | Loan Amount |
|---|---|---|---|
| Open | Prb Llc | $2,500,000 | |
| Closed | Prb Llc | $2,500,000 |
Source: Public Records
Tax History Compared to Growth
Tax History
| Year | Tax Paid | Tax Assessment Tax Assessment Total Assessment is a certain percentage of the fair market value that is determined by local assessors to be the total taxable value of land and additions on the property. | Land | Improvement |
|---|---|---|---|---|
| 2025 | $5,027 | $257,000 | $91,100 | $165,900 |
| 2024 | $4,359 | $213,800 | $86,800 | $127,000 |
| 2023 | $3,877 | $197,300 | $78,900 | $118,400 |
| 2022 | $4,591 | $205,700 | $75,200 | $130,500 |
| 2021 | $4,574 | $197,000 | $74,000 | $123,000 |
| 2020 | $4,517 | $197,000 | $74,000 | $123,000 |
| 2019 | $4,405 | $197,000 | $74,000 | $123,000 |
| 2018 | $4,076 | $181,700 | $69,200 | $112,500 |
| 2017 | $3,948 | $181,700 | $69,200 | $112,500 |
| 2016 | $4,355 | $199,700 | $69,200 | $130,500 |
| 2015 | $4,432 | $196,900 | $69,200 | $127,700 |
| 2014 | $4,049 | $197,200 | $69,200 | $128,000 |
Source: Public Records
Map
Nearby Homes