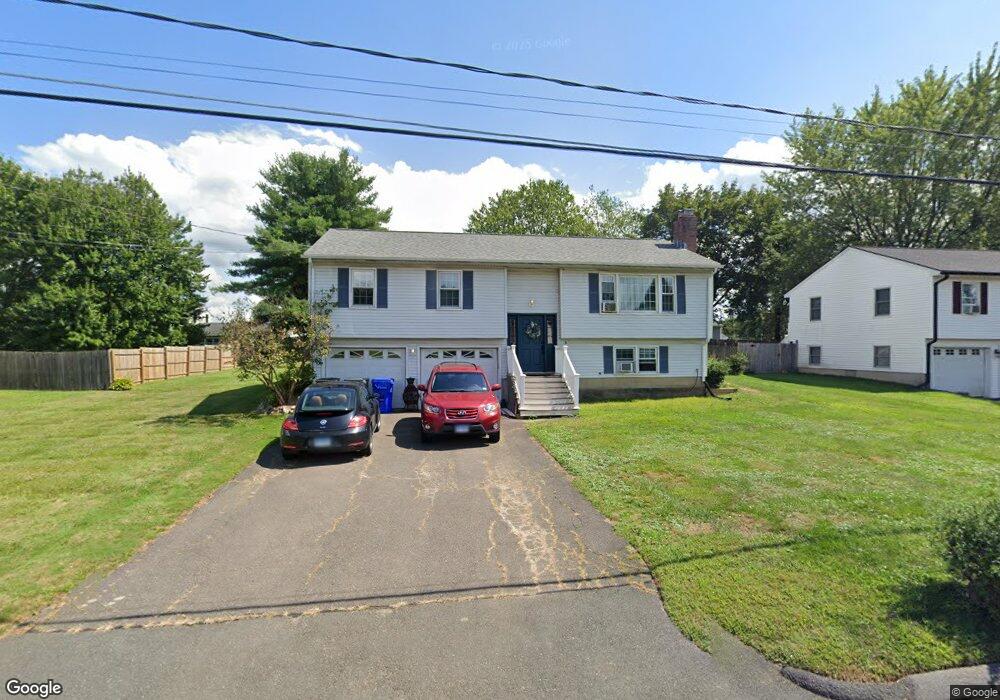
50 Kimberly Dr Enfield, CT 06082
Estimated Value: $362,000 - $381,000
3
Beds
3
Baths
1,192
Sq Ft
$314/Sq Ft
Est. Value
About This Home
This home is located at 50 Kimberly Dr, Enfield, CT 06082 and is currently estimated at $374,826, approximately $314 per square foot. 50 Kimberly Dr is a home located in Hartford County with nearby schools including Edgar H. Parkman School, Nathan Hale Elementary School, and John F. Kennedy Middle School.
Ownership History
Date
Name
Owned For
Owner Type
Purchase Details
Closed on
Aug 1, 2001
Sold by
Deonarine David and Deonarine Romie
Bought by
Malcolm James and Malcolm Kerri
Current Estimated Value
Home Financials for this Owner
Home Financials are based on the most recent Mortgage that was taken out on this home.
Original Mortgage
$142,800
Outstanding Balance
$55,664
Interest Rate
7.14%
Estimated Equity
$319,162
Purchase Details
Closed on
Jan 4, 2001
Sold by
Concept Bldrs Glastbry
Bought by
Km Dev Llc
Home Financials for this Owner
Home Financials are based on the most recent Mortgage that was taken out on this home.
Original Mortgage
$324,000
Interest Rate
7.69%
Purchase Details
Closed on
Jul 2, 1992
Sold by
Bagley Brian and Bagley Michael
Bought by
Boodhoo David and Boodhoo Ronnie
Purchase Details
Closed on
Apr 1, 1987
Sold by
Mascor Builders
Bought by
Bogley Michael
Create a Home Valuation Report for This Property
The Home Valuation Report is an in-depth analysis detailing your home's value as well as a comparison with similar homes in the area
Home Values in the Area
Average Home Value in this Area
Purchase History
| Date | Buyer | Sale Price | Title Company |
|---|---|---|---|
| Malcolm James | $168,000 | -- | |
| Km Dev Llc | $130,000 | -- | |
| Boodhoo David | $135,000 | -- | |
| Bogley Michael | $107,500 | -- |
Source: Public Records
Mortgage History
| Date | Status | Borrower | Loan Amount |
|---|---|---|---|
| Open | Bogley Michael | $67,600 | |
| Open | Bogley Michael | $142,800 | |
| Previous Owner | Bogley Michael | $324,000 | |
| Previous Owner | Bogley Michael | $116,000 |
Source: Public Records
Tax History Compared to Growth
Tax History
| Year | Tax Paid | Tax Assessment Tax Assessment Total Assessment is a certain percentage of the fair market value that is determined by local assessors to be the total taxable value of land and additions on the property. | Land | Improvement |
|---|---|---|---|---|
| 2025 | $6,270 | $179,200 | $56,600 | $122,600 |
| 2024 | $6,102 | $179,200 | $56,600 | $122,600 |
| 2023 | $6,057 | $179,200 | $56,600 | $122,600 |
| 2022 | $5,500 | $179,200 | $56,600 | $122,600 |
| 2021 | $5,262 | $140,200 | $46,890 | $93,310 |
| 2020 | $5,262 | $140,200 | $46,890 | $93,310 |
| 2019 | $5,276 | $140,200 | $46,890 | $93,310 |
| 2018 | $5,187 | $140,200 | $46,890 | $93,310 |
| 2017 | $4,897 | $140,200 | $46,890 | $93,310 |
| 2016 | $4,559 | $132,880 | $46,890 | $85,990 |
| 2015 | $2,509 | $132,880 | $46,890 | $85,990 |
| 2014 | $4,303 | $132,880 | $46,890 | $85,990 |
Source: Public Records
Map
Nearby Homes