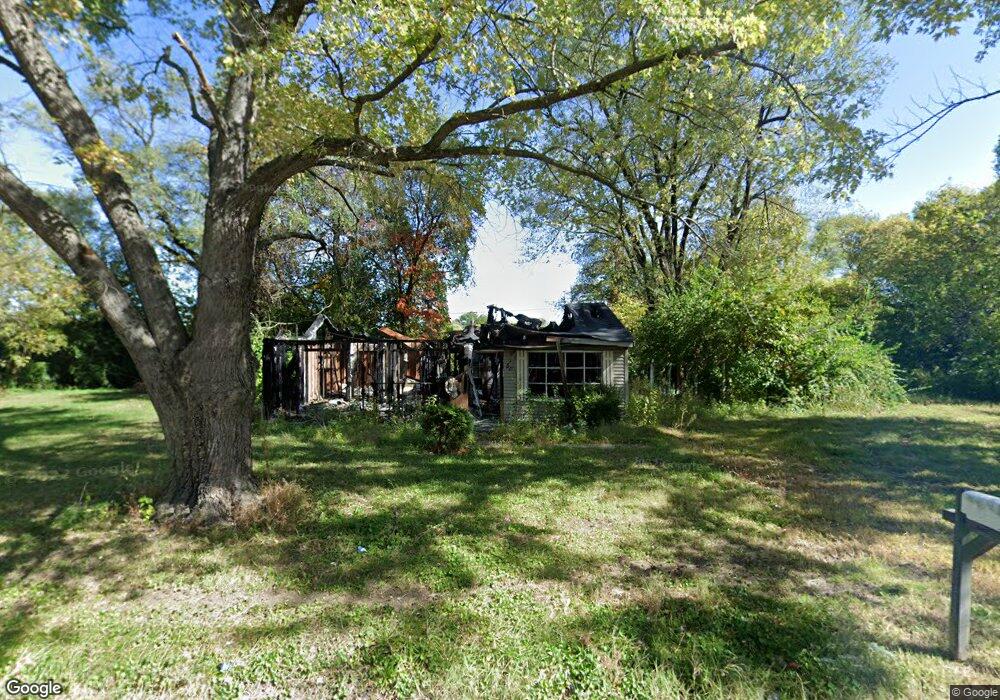
50 Lauralee Dr East Saint Louis, IL 62206
Estimated Value: $37,000 - $86,000
--
Bed
--
Bath
925
Sq Ft
$62/Sq Ft
Est. Value
About This Home
This home is located at 50 Lauralee Dr, East Saint Louis, IL 62206 and is currently estimated at $57,216, approximately $61 per square foot. 50 Lauralee Dr is a home located in St. Clair County.
Ownership History
Date
Name
Owned For
Owner Type
Purchase Details
Closed on
Sep 11, 2024
Sold by
St Clair County Clerk
Bought by
St Clair County
Current Estimated Value
Purchase Details
Closed on
May 13, 2013
Sold by
Nesbitt Betty
Bought by
Jackson Angel
Purchase Details
Closed on
Oct 14, 2009
Sold by
St Clair County
Bought by
Nesbitt Betty
Purchase Details
Closed on
Jul 1, 2009
Sold by
Kimble Teresa
Bought by
County Of St Clair
Purchase Details
Closed on
Mar 14, 2002
Sold by
Kimble Juanita
Bought by
Kimble Teresa
Purchase Details
Closed on
Aug 13, 2001
Sold by
Kimble Teresa
Bought by
Kimble Juanita
Purchase Details
Closed on
Apr 30, 2001
Sold by
Kimble Juanita
Bought by
Kimble Teresa
Purchase Details
Closed on
Nov 30, 2000
Bought by
Jackson Angel
Create a Home Valuation Report for This Property
The Home Valuation Report is an in-depth analysis detailing your home's value as well as a comparison with similar homes in the area
Home Values in the Area
Average Home Value in this Area
Purchase History
| Date | Buyer | Sale Price | Title Company |
|---|---|---|---|
| St Clair County | -- | None Available | |
| Jackson Angel | -- | None Available | |
| Nesbitt Betty | -- | None Available | |
| County Of St Clair | -- | None Available | |
| Kimble Teresa | -- | -- | |
| Kimble Juanita | -- | -- | |
| Kimble Teresa | -- | -- | |
| Jackson Angel | $48,000 | -- |
Source: Public Records
Tax History Compared to Growth
Tax History
| Year | Tax Paid | Tax Assessment Tax Assessment Total Assessment is a certain percentage of the fair market value that is determined by local assessors to be the total taxable value of land and additions on the property. | Land | Improvement |
|---|---|---|---|---|
| 2024 | -- | $110 | $55 | $55 |
| 2023 | $788 | $5,320 | $418 | $4,902 |
| 2022 | $676 | $4,662 | $366 | $4,296 |
| 2021 | $701 | $4,418 | $347 | $4,071 |
| 2020 | $690 | $4,152 | $364 | $3,788 |
| 2019 | $716 | $4,152 | $364 | $3,788 |
| 2018 | $725 | $4,212 | $369 | $3,843 |
| 2017 | $769 | $4,110 | $360 | $3,750 |
| 2016 | $849 | $4,544 | $359 | $4,185 |
| 2014 | $693 | $4,494 | $355 | $4,139 |
| 2013 | $216 | $4,215 | $333 | $3,882 |
Source: Public Records
Map
Nearby Homes