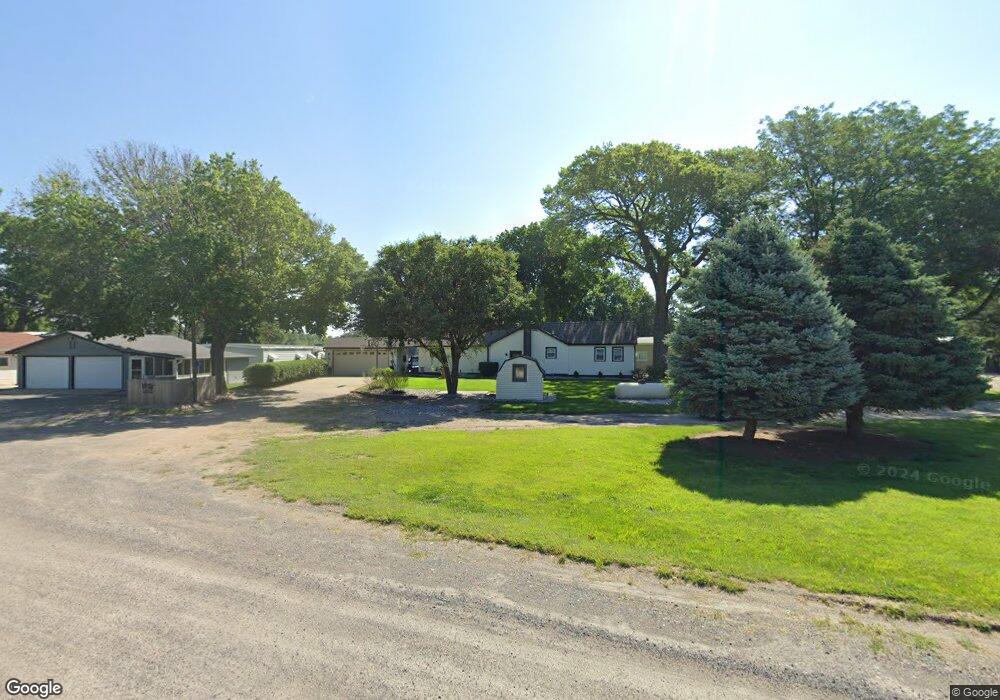
500 Andys North Shore Dr Norfolk, NE 68701
Estimated Value: $184,497 - $243,000
2
Beds
2
Baths
1,279
Sq Ft
$167/Sq Ft
Est. Value
About This Home
This home is located at 500 Andys North Shore Dr, Norfolk, NE 68701 and is currently estimated at $213,374, approximately $166 per square foot. 500 Andys North Shore Dr is a home located in Madison County with nearby schools including Norfolk Senior High School.
Ownership History
Date
Name
Owned For
Owner Type
Purchase Details
Closed on
Jan 25, 2006
Sold by
Sock Jeffrey J and Sock Deborah R
Bought by
Sock Jeffrey J
Current Estimated Value
Purchase Details
Closed on
Jul 1, 2004
Sold by
Andersen Leland D and Andersen Lynda M
Bought by
Sock Jeffrey J and Sock Deborah R
Purchase Details
Closed on
Feb 17, 2004
Sold by
Anderson Glynn
Bought by
Andersen Leland D and Andersen Lynda M
Create a Home Valuation Report for This Property
The Home Valuation Report is an in-depth analysis detailing your home's value as well as a comparison with similar homes in the area
Home Values in the Area
Average Home Value in this Area
Purchase History
| Date | Buyer | Sale Price | Title Company |
|---|---|---|---|
| Sock Jeffrey J | -- | -- | |
| Sock Jeffrey J | $53,500 | -- | |
| Andersen Leland D | $42,500 | -- |
Source: Public Records
Tax History Compared to Growth
Tax History
| Year | Tax Paid | Tax Assessment Tax Assessment Total Assessment is a certain percentage of the fair market value that is determined by local assessors to be the total taxable value of land and additions on the property. | Land | Improvement |
|---|---|---|---|---|
| 2024 | $1,209 | $122,210 | $0 | $122,210 |
| 2023 | $1,696 | $109,116 | $0 | $109,116 |
| 2022 | $1,492 | $95,716 | $0 | $95,716 |
| 2021 | $1,323 | $85,461 | $0 | $85,461 |
| 2020 | $1,339 | $85,461 | $0 | $85,461 |
| 2019 | $1,365 | $85,461 | $0 | $85,461 |
| 2018 | $1,225 | $78,405 | $0 | $78,405 |
| 2017 | $1,128 | $71,931 | $0 | $71,931 |
| 2016 | $1,041 | $65,992 | $0 | $65,992 |
| 2015 | $1,043 | $65,992 | $0 | $65,992 |
| 2014 | $994 | $60,543 | $0 | $60,543 |
| 2013 | $1,037 | $60,543 | $0 | $60,543 |
Source: Public Records
Map
Nearby Homes
- 808 Andy's Shore N
- 1201 S Victory Rd
- 1101 S Victory Rd
- 1100 S Victory Rd
- 2208 S 1st St
- 100 Helen Ave
- 101 Henry Ave
- 100 Henry Ave
- 101 Adealia Ave
- 101 Frank Ave
- 1405 S 2nd St
- 1406 S 2nd St
- 1303 S 3rd St
- 1001 Prime Stop Way
- 1100 Prime Stop Way
- 1210 Prime Stop Way
- 1104 S 2nd St
- 922 S 2nd St
- 804 Volkman Dr
- 809 S 1st St
- 502 Andys North Shore Dr
- 508 Andys North Shore Dr
- 510 Andys North Shore Dr
- 506 Andys North Shore Dr
- 512 Andys North Shore Dr
- 604 Andys North Shore Dr
- Lot 4 & 5 Cedar Lake
- 600 Andys North Shore Dr
- 504 Andys North Shore Dr
- 602 Andys North Shore Dr
- 808 Andys North Shore Dr
- 520 Andy's Lake Rd
- 708 Andys North Shore Dr
- 600 Andys Lake Rd
- 711 Andys Lake Cir
- 604 Andys Lake Rd
- 702 Andys North Shore Dr
- 706 Andys North Shore Dr
- 700 Andys North Shore Dr
- 704 Andys North Shore Dr