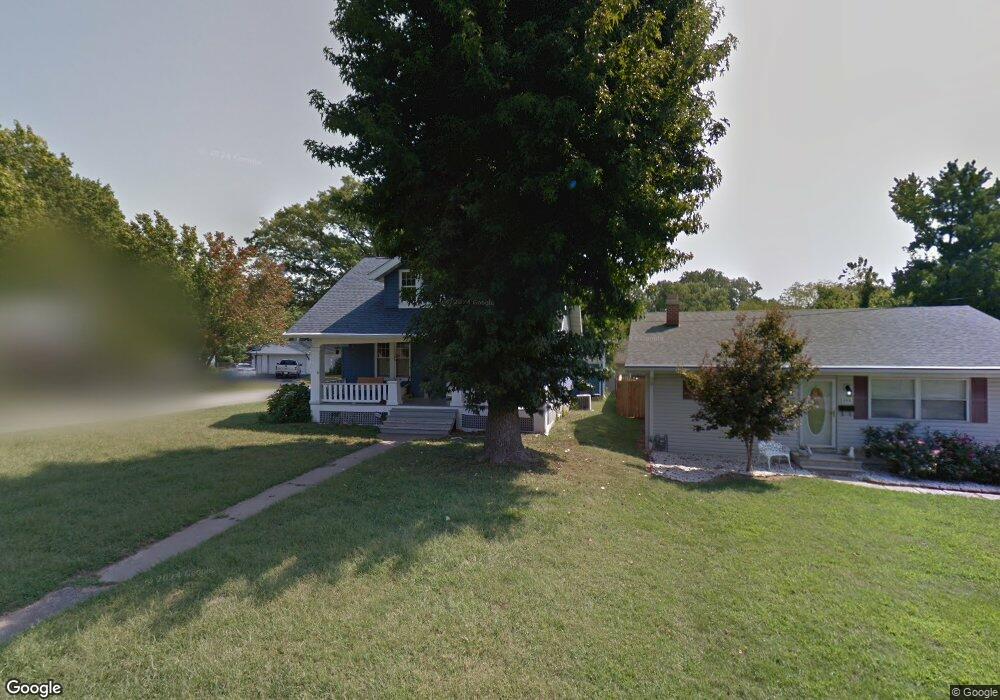
500 Greenwood Place Collinsville, IL 62234
Estimated Value: $148,000 - $213,000
--
Bed
--
Bath
840
Sq Ft
$212/Sq Ft
Est. Value
About This Home
This home is located at 500 Greenwood Place, Collinsville, IL 62234 and is currently estimated at $177,693, approximately $211 per square foot. 500 Greenwood Place is a home located in St. Clair County with nearby schools including Jefferson Elementary School, Dorris Intermediate School, and Collinsville Middle School.
Ownership History
Date
Name
Owned For
Owner Type
Purchase Details
Closed on
Aug 29, 2013
Sold by
Dawson Danny U and Dawson Karen Y
Bought by
Hubbard Amy C and Dawson Karen Y
Current Estimated Value
Purchase Details
Closed on
Feb 6, 2013
Sold by
Compton Scott and Compton Lea
Bought by
Compton Lea
Home Financials for this Owner
Home Financials are based on the most recent Mortgage that was taken out on this home.
Original Mortgage
$85,000
Outstanding Balance
$15,855
Interest Rate
3%
Mortgage Type
New Conventional
Estimated Equity
$161,838
Purchase Details
Closed on
Nov 4, 2002
Sold by
Whaley Orville O and Whaley Willie Ruth
Bought by
Compton Scott and Compton Lea
Home Financials for this Owner
Home Financials are based on the most recent Mortgage that was taken out on this home.
Original Mortgage
$86,300
Interest Rate
6.13%
Mortgage Type
Balloon
Create a Home Valuation Report for This Property
The Home Valuation Report is an in-depth analysis detailing your home's value as well as a comparison with similar homes in the area
Home Values in the Area
Average Home Value in this Area
Purchase History
| Date | Buyer | Sale Price | Title Company |
|---|---|---|---|
| Hubbard Amy C | -- | None Available | |
| Compton Lea | -- | Abstracts & Titles Inc | |
| Compton Scott | $86,500 | -- |
Source: Public Records
Mortgage History
| Date | Status | Borrower | Loan Amount |
|---|---|---|---|
| Open | Compton Lea | $85,000 | |
| Closed | Compton Scott | $86,300 |
Source: Public Records
Tax History Compared to Growth
Tax History
| Year | Tax Paid | Tax Assessment Tax Assessment Total Assessment is a certain percentage of the fair market value that is determined by local assessors to be the total taxable value of land and additions on the property. | Land | Improvement |
|---|---|---|---|---|
| 2024 | $2,895 | $49,216 | $2,703 | $46,513 |
| 2023 | $2,624 | $43,547 | $2,392 | $41,155 |
| 2022 | $2,553 | $42,692 | $2,344 | $40,348 |
| 2021 | $2,490 | $40,520 | $2,225 | $38,295 |
| 2020 | $2,441 | $38,383 | $2,108 | $36,275 |
| 2019 | $2,369 | $38,383 | $2,108 | $36,275 |
| 2018 | $2,227 | $36,297 | $2,085 | $34,212 |
| 2017 | $2,235 | $34,825 | $2,001 | $32,824 |
| 2016 | $2,272 | $34,039 | $1,956 | $32,083 |
| 2014 | $2,231 | $35,661 | $1,950 | $33,711 |
| 2013 | $2,379 | $36,318 | $1,986 | $34,332 |
Source: Public Records
Map
Nearby Homes
- 625 Greenwood Place
- 9 Grandview Dr
- 11 Davis Place
- 151 Helen Place
- 101 Osage Dr
- 717 Greenwood Place
- 202 Keeneland Ct
- 710 Saint Louis Rd
- 208 Coral Dr
- 408 Hillside Dr
- 116 Moffett Ave
- 114 Moffett Ave Unit 116
- 89 Fox Run Rd
- 128 Courtland Place
- 1109 Saint Clair Ave
- Lot 36 Jefferson Ave
- Lot 20 Jefferson Ave
- Lot 38 Jefferson Ave
- Lot 37 Jefferson Ave
- Lot 32 Jefferson Ave
- 504 Greenwood Place
- 1004 Curtis Place
- 506 Greenwood Place
- 414 Greenwood Place
- 508 Greenwood Place
- 503 Greenwood Place
- 505 Greenwood Place
- 412 Greenwood Place
- 501 Greenwood Place
- 1000 Curtis Place
- 600 Greenwood Place
- 507 Greenwood Place
- 215 Highland Place
- 427 Greenwood Place
- 509 Greenwood Place
- 213 Highland Place
- 413 Greenwood Place
- 408 Greenwood Place
- 602 Greenwood Place
- 211 Highland Place