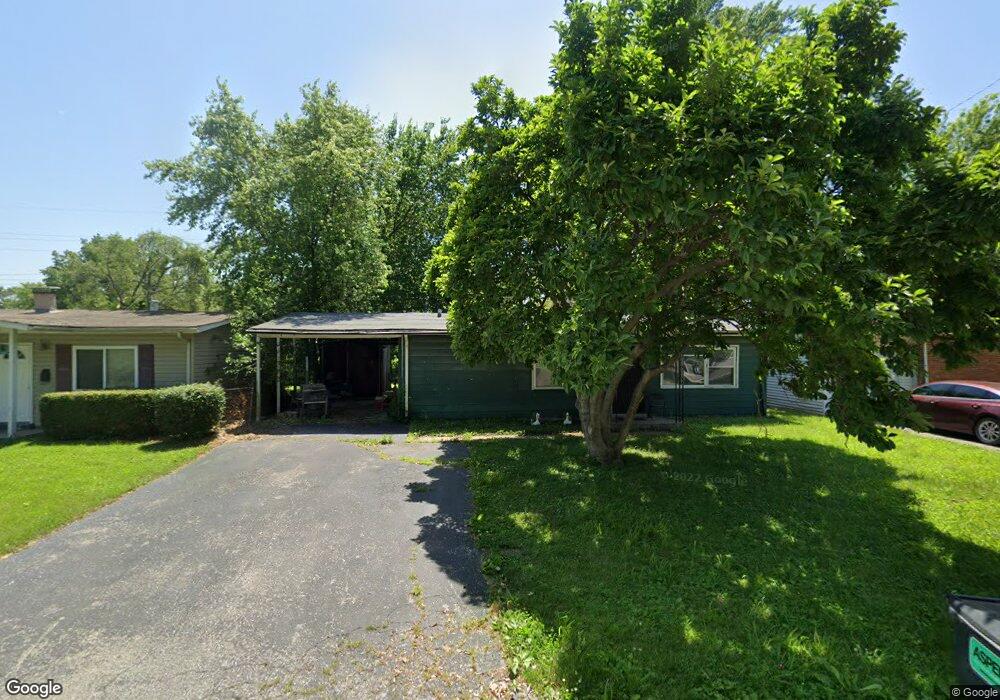
500 Saint Thomas Ln East Saint Louis, IL 62206
Estimated Value: $63,067 - $96,000
--
Bed
--
Bath
864
Sq Ft
$85/Sq Ft
Est. Value
About This Home
This home is located at 500 Saint Thomas Ln, East Saint Louis, IL 62206 and is currently estimated at $73,017, approximately $84 per square foot. 500 Saint Thomas Ln is a home located in St. Clair County.
Ownership History
Date
Name
Owned For
Owner Type
Purchase Details
Closed on
Jul 18, 2025
Sold by
Stott James
Bought by
Dream Key Home Buyers Llc
Current Estimated Value
Purchase Details
Closed on
Sep 20, 2021
Sold by
Scott James
Bought by
St Clair County and Trust No 06 03 0 234 032
Purchase Details
Closed on
Jul 18, 2017
Sold by
Scott James
Bought by
County Of Saint Clair and Trust #06-03-0-234-032
Purchase Details
Closed on
Dec 27, 2013
Sold by
Smith Parke
Bought by
Scott James
Purchase Details
Closed on
Jun 30, 2006
Sold by
Citifinancial Mortgage Co Inc
Bought by
Smith Parke A
Home Financials for this Owner
Home Financials are based on the most recent Mortgage that was taken out on this home.
Original Mortgage
$25,900
Interest Rate
7.59%
Mortgage Type
Construction
Purchase Details
Closed on
Mar 30, 2006
Sold by
Perry Pamela B
Bought by
Citifinancial Mortgage Co Inc
Create a Home Valuation Report for This Property
The Home Valuation Report is an in-depth analysis detailing your home's value as well as a comparison with similar homes in the area
Home Values in the Area
Average Home Value in this Area
Purchase History
| Date | Buyer | Sale Price | Title Company |
|---|---|---|---|
| Dream Key Home Buyers Llc | $17,000 | None Available | |
| St Clair County | -- | None Available | |
| County Of Saint Clair | -- | Attorney | |
| Scott James | -- | None Available | |
| Smith Parke A | $28,000 | Fatic | |
| Citifinancial Mortgage Co Inc | -- | None Available |
Source: Public Records
Mortgage History
| Date | Status | Borrower | Loan Amount |
|---|---|---|---|
| Previous Owner | Smith Parke A | $25,900 |
Source: Public Records
Tax History Compared to Growth
Tax History
| Year | Tax Paid | Tax Assessment Tax Assessment Total Assessment is a certain percentage of the fair market value that is determined by local assessors to be the total taxable value of land and additions on the property. | Land | Improvement |
|---|---|---|---|---|
| 2024 | $941 | $8,768 | $1,117 | $7,651 |
| 2023 | $940 | $7,927 | $1,010 | $6,917 |
| 2022 | $981 | $6,947 | $885 | $6,062 |
| 2021 | $1,062 | $6,583 | $839 | $5,744 |
| 2020 | $1,153 | $7,530 | $878 | $6,652 |
| 2019 | $1,154 | $7,530 | $878 | $6,652 |
| 2018 | $1,749 | $7,640 | $891 | $6,749 |
| 2017 | $0 | $100 | $50 | $50 |
| 2016 | $496 | $2,023 | $867 | $1,156 |
| 2014 | $409 | $2,001 | $858 | $1,143 |
| 2013 | $2,529 | $1,877 | $805 | $1,072 |
Source: Public Records
Map
Nearby Homes
- 120 Saint Leo Dr
- 125 Saint Leo Dr
- 310 E 5th St
- 111 Saint Leo Dr
- 803 Saint Thomas Ln
- 804 Saint Thomas Ln
- 725 Saint Nicholas Dr
- 525 Saint Leo Dr
- 808 Saint Thomas Ln
- 810 Saint Thomas Ln
- 603 Saint Nicholas Dr
- 510 Saint Paul Dr
- 209 W 6th St
- 116 Saint Barbara Ln
- 114 Saint Barbara Ln
- 221 Main St
- 528 Saint Paul Dr
- 600 Plum St
- 225 W 2nd St
- 706 Saint Barbara Ln
- 406 Saint Thomas Ln
- 502 Saint Thomas Ln
- 404 St Thomas Ln
- 404 Saint Thomas Ln
- 504 Saint Thomas Ln
- 409 E 5th St
- 501 E 5th St
- 407 E 5th St
- 405 E 5th St
- 503 E 5th St
- 152 St James Ln
- 402 Saint Thomas Ln
- 149 Saint James Ln
- 505 Saint Thomas Ln
- 403 E 5th St
- 505 E 5th St
- 401 Saint Thomas Ln
- 508 Saint Thomas Ln
- 150 Saint James Ln
- 400 Saint Thomas Ln