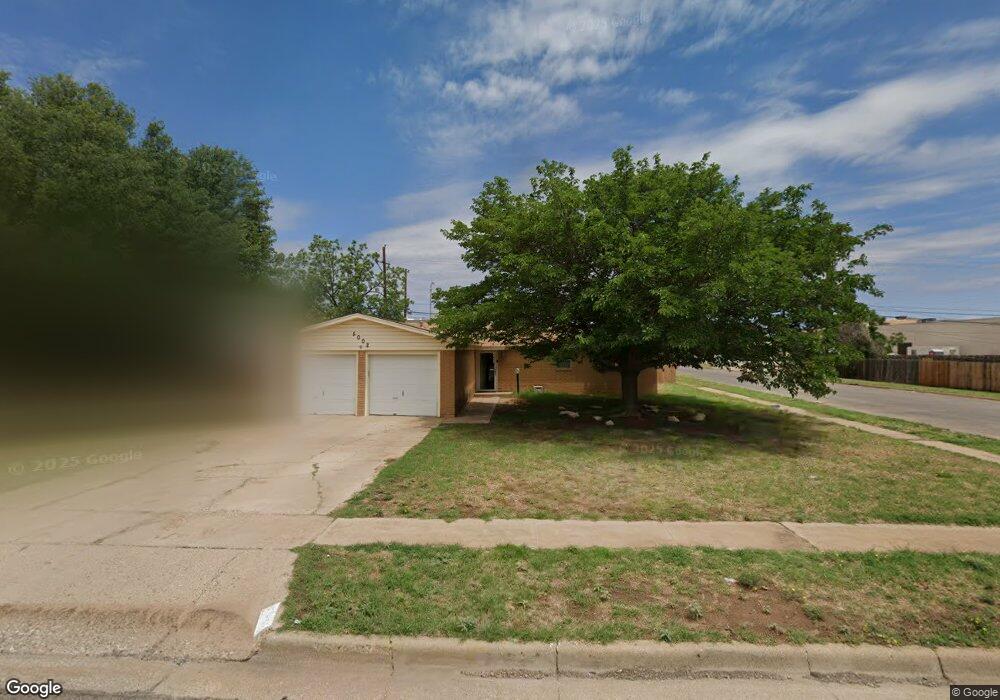
5002 52nd St Lubbock, TX 79414
Stubbs-Stewart NeighborhoodEstimated Value: $145,000 - $167,000
3
Beds
2
Baths
1,478
Sq Ft
$107/Sq Ft
Est. Value
About This Home
This home is located at 5002 52nd St, Lubbock, TX 79414 and is currently estimated at $157,601, approximately $106 per square foot. 5002 52nd St is a home located in Lubbock County with nearby schools including Williams Elementary School, Commander William C. McCool Academy, and Irons Middle School.
Ownership History
Date
Name
Owned For
Owner Type
Purchase Details
Closed on
Mar 7, 2019
Sold by
Iversen Shelly and Iverson Shelly
Bought by
Excess Investments Llc
Current Estimated Value
Home Financials for this Owner
Home Financials are based on the most recent Mortgage that was taken out on this home.
Original Mortgage
$80,000
Outstanding Balance
$51,654
Interest Rate
4.4%
Mortgage Type
Purchase Money Mortgage
Estimated Equity
$105,947
Purchase Details
Closed on
Dec 3, 2012
Sold by
Holder Wayne S and Holder Mary K
Bought by
Iverson Shelly
Create a Home Valuation Report for This Property
The Home Valuation Report is an in-depth analysis detailing your home's value as well as a comparison with similar homes in the area
Home Values in the Area
Average Home Value in this Area
Purchase History
| Date | Buyer | Sale Price | Title Company |
|---|---|---|---|
| Excess Investments Llc | -- | None Available | |
| Iverson Shelly | -- | None Available |
Source: Public Records
Mortgage History
| Date | Status | Borrower | Loan Amount |
|---|---|---|---|
| Open | Excess Investments Llc | $80,000 |
Source: Public Records
Tax History Compared to Growth
Tax History
| Year | Tax Paid | Tax Assessment Tax Assessment Total Assessment is a certain percentage of the fair market value that is determined by local assessors to be the total taxable value of land and additions on the property. | Land | Improvement |
|---|---|---|---|---|
| 2025 | $2,615 | $141,436 | $26,000 | $115,436 |
| 2024 | $2,615 | $144,016 | $26,000 | $118,016 |
| 2023 | $2,354 | $126,631 | $13,775 | $112,856 |
| 2022 | $2,250 | $111,153 | $13,775 | $97,378 |
| 2021 | $2,157 | $100,695 | $13,775 | $86,920 |
| 2020 | $2,165 | $99,574 | $13,775 | $85,799 |
| 2019 | $2,245 | $100,016 | $13,775 | $86,241 |
| 2018 | $2,731 | $121,480 | $13,775 | $107,705 |
| 2017 | $2,486 | $110,436 | $13,775 | $96,661 |
| 2016 | $2,260 | $100,396 | $13,775 | $86,621 |
| 2015 | $1,787 | $95,637 | $7,250 | $88,387 |
| 2014 | $1,787 | $88,692 | $7,250 | $81,442 |
Source: Public Records
Map
Nearby Homes