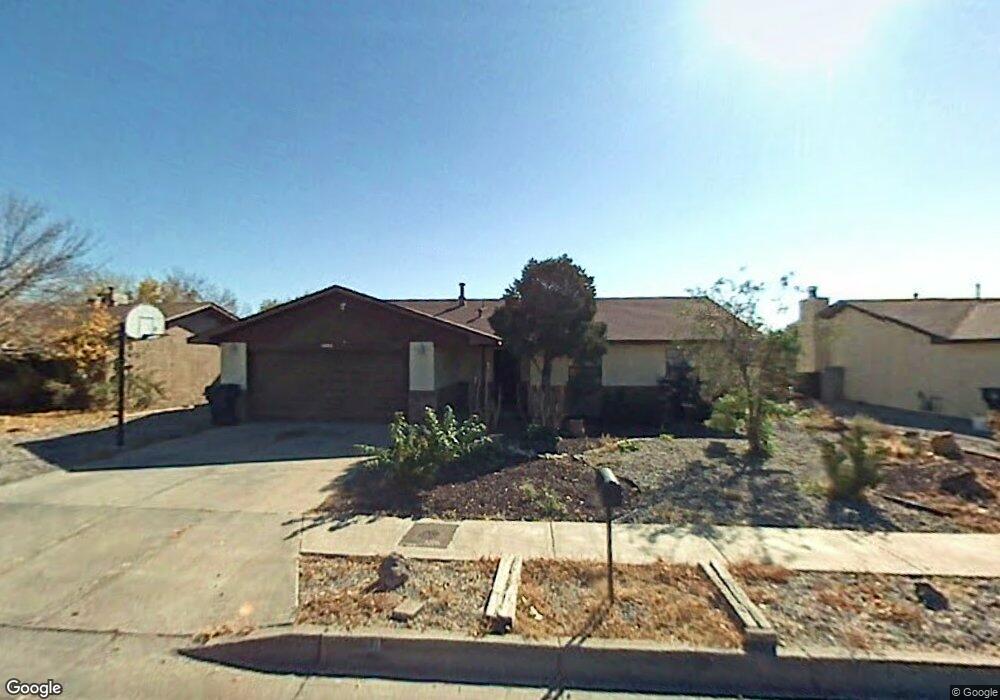
5008 Sooner Trail NW Albuquerque, NM 87120
Taylor Ranch NeighborhoodEstimated Value: $294,000 - $342,000
3
Beds
2
Baths
1,374
Sq Ft
$229/Sq Ft
Est. Value
About This Home
This home is located at 5008 Sooner Trail NW, Albuquerque, NM 87120 and is currently estimated at $314,853, approximately $229 per square foot. 5008 Sooner Trail NW is a home located in Bernalillo County with nearby schools including Chamiza Elementary School, L.B. Johnson Middle School, and Volcano Vista High School.
Ownership History
Date
Name
Owned For
Owner Type
Purchase Details
Closed on
Nov 18, 2004
Sold by
Hud
Bought by
Ramirez Mayra
Current Estimated Value
Home Financials for this Owner
Home Financials are based on the most recent Mortgage that was taken out on this home.
Original Mortgage
$109,610
Outstanding Balance
$54,102
Interest Rate
5.72%
Mortgage Type
Purchase Money Mortgage
Estimated Equity
$260,751
Purchase Details
Closed on
Jul 14, 2004
Sold by
Chase Manhattan Mortgage Corp
Bought by
Hud
Purchase Details
Closed on
Jun 24, 2004
Sold by
Prudencio Richard A and Prudencio Martha G
Bought by
Chase Manhattan Mortgage Corp
Purchase Details
Closed on
Feb 19, 1999
Sold by
Ratheal Steve W and Ratheal Sherry G
Bought by
Prudencio Richard A and Prudencio Martha G
Home Financials for this Owner
Home Financials are based on the most recent Mortgage that was taken out on this home.
Original Mortgage
$103,600
Interest Rate
6.83%
Mortgage Type
FHA
Create a Home Valuation Report for This Property
The Home Valuation Report is an in-depth analysis detailing your home's value as well as a comparison with similar homes in the area
Home Values in the Area
Average Home Value in this Area
Purchase History
| Date | Buyer | Sale Price | Title Company |
|---|---|---|---|
| Ramirez Mayra | -- | Fidelity National Title Co | |
| Hud | -- | -- | |
| Chase Manhattan Mortgage Corp | -- | -- | |
| Prudencio Richard A | -- | Stewart Title |
Source: Public Records
Mortgage History
| Date | Status | Borrower | Loan Amount |
|---|---|---|---|
| Open | Ramirez Mayra | $109,610 | |
| Previous Owner | Prudencio Richard A | $103,600 |
Source: Public Records
Tax History Compared to Growth
Tax History
| Year | Tax Paid | Tax Assessment Tax Assessment Total Assessment is a certain percentage of the fair market value that is determined by local assessors to be the total taxable value of land and additions on the property. | Land | Improvement |
|---|---|---|---|---|
| 2025 | $2,433 | $59,385 | $12,258 | $47,127 |
| 2024 | $2,433 | $57,655 | $11,901 | $45,754 |
| 2023 | $2,392 | $55,977 | $11,555 | $44,422 |
| 2022 | $2,312 | $54,346 | $11,218 | $43,128 |
| 2021 | $2,234 | $52,764 | $10,892 | $41,872 |
| 2020 | $2,197 | $51,228 | $10,575 | $40,653 |
| 2019 | $2,133 | $49,736 | $10,267 | $39,469 |
| 2018 | $2,057 | $49,736 | $10,267 | $39,469 |
| 2017 | $1,994 | $48,287 | $9,968 | $38,319 |
| 2016 | $1,937 | $45,516 | $9,396 | $36,120 |
| 2015 | $44,190 | $44,190 | $9,122 | $35,068 |
| 2014 | $1,822 | $42,903 | $8,856 | $34,047 |
| 2013 | -- | $41,654 | $8,599 | $33,055 |
Source: Public Records
Map
Nearby Homes
- 6921 El Cajon Ct NW
- 5136 Roanoke Ave NW
- 7432 Primrose Dr NW
- 4736 Galleta Rd NW
- 4612 Lobelia Rd NW
- 7532 Deerfield Rd NW
- 7516 Wells Fargo Trail NW
- 5429 Gold Rush Dr NW
- 5404 Territorial Rd NW
- 5333 Roanoke Ave NW
- 4500 Samara Rd NW
- 5419 Timberline Ave NW
- 7557 Richmond Hill Rd NW
- 7434 Riverton Dr NW
- 7939 Independence Dr NW
- 5305 Desert Sand Place NW
- 7300 Target Ln NW
- 7816 Bursera Dr NW
- 6212 Prairie Sage Dr NW
- 7809 Juneberry St NW
- 5012 Sooner Trail NW
- 5004 Sooner Trail NW
- 5016 Sooner Trail NW
- 6944 El Cajon Ct NW
- 5000 Sooner Trail NW
- 5009 Sooner Trail NW
- 6940 El Cajon Ct NW
- 6949 El Cajon Ct NW
- 5005 Sooner Trail NW
- 7201 Santa fe Trail NW
- 6945 El Cajon Ct NW
- 6936 El Cajon Ct NW
- 4920 Sooner Trail NW
- 7204 Santa fe Trail NW
- 6932 El Cajon Ct NW
- 6941 El Cajon Ct NW
- 7205 Santa fe Trail NW
- 5001 Sooner Trail NW
- 6929 Los Alisos Ct NW
- 6928 El Cajon Ct NW