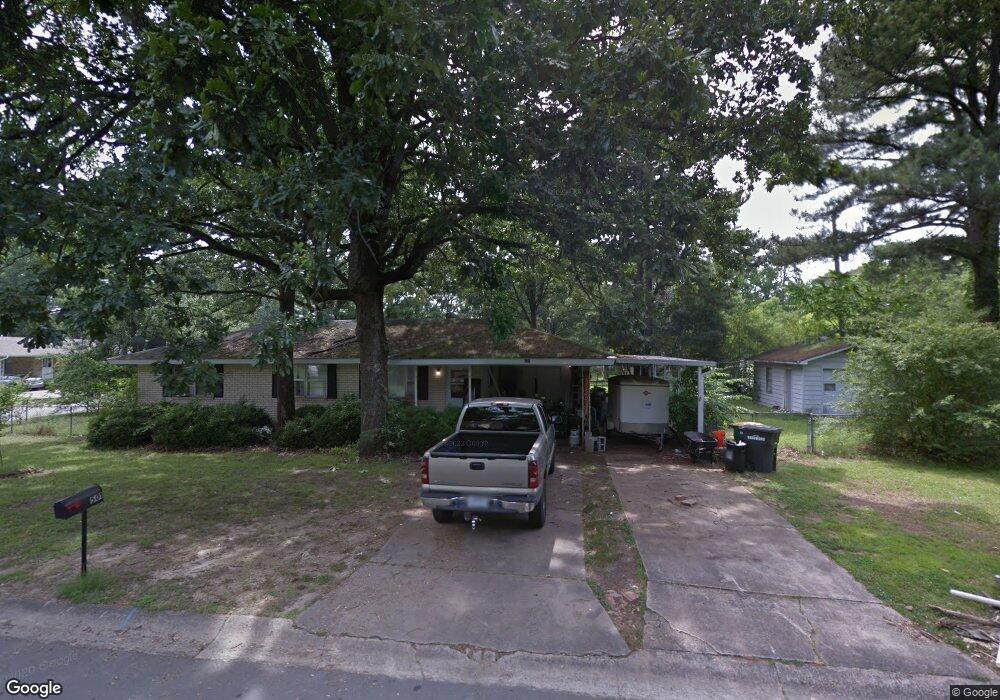
501 Hillwood Dr Sherwood, AR 72120
Estimated Value: $147,000 - $192,000
--
Bed
3
Baths
1,400
Sq Ft
$115/Sq Ft
Est. Value
About This Home
This home is located at 501 Hillwood Dr, Sherwood, AR 72120 and is currently estimated at $161,595, approximately $115 per square foot. 501 Hillwood Dr is a home located in Pulaski County with nearby schools including Sylvan Hills Elementary School, Sylvan Hills Middle School, and Sylvan Hills High School.
Ownership History
Date
Name
Owned For
Owner Type
Purchase Details
Closed on
Oct 25, 2001
Sold by
Metropolitan National Bank
Bought by
Head Buddy and Head Heron Herbert
Current Estimated Value
Home Financials for this Owner
Home Financials are based on the most recent Mortgage that was taken out on this home.
Original Mortgage
$58,932
Outstanding Balance
$4,328
Interest Rate
6.71%
Mortgage Type
Purchase Money Mortgage
Estimated Equity
$157,267
Purchase Details
Closed on
May 17, 2001
Sold by
Rylance Kevin D and Rylance Karen A
Bought by
Metropolitan National Bank and Teague Jeff
Purchase Details
Closed on
Jan 27, 1999
Sold by
Wright Gene T
Bought by
Rylance Kevin D and Rylance Karen A
Home Financials for this Owner
Home Financials are based on the most recent Mortgage that was taken out on this home.
Original Mortgage
$63,720
Interest Rate
6.79%
Mortgage Type
Purchase Money Mortgage
Create a Home Valuation Report for This Property
The Home Valuation Report is an in-depth analysis detailing your home's value as well as a comparison with similar homes in the area
Home Values in the Area
Average Home Value in this Area
Purchase History
| Date | Buyer | Sale Price | Title Company |
|---|---|---|---|
| Head Buddy | $64,000 | -- | |
| Metropolitan National Bank | $50,000 | -- | |
| Rylance Kevin D | $71,000 | Beach Abstract & Guaranty Co |
Source: Public Records
Mortgage History
| Date | Status | Borrower | Loan Amount |
|---|---|---|---|
| Open | Head Buddy | $58,932 | |
| Previous Owner | Rylance Kevin D | $63,720 |
Source: Public Records
Tax History Compared to Growth
Tax History
| Year | Tax Paid | Tax Assessment Tax Assessment Total Assessment is a certain percentage of the fair market value that is determined by local assessors to be the total taxable value of land and additions on the property. | Land | Improvement |
|---|---|---|---|---|
| 2025 | $1,362 | $26,459 | $4,200 | $22,259 |
| 2024 | $1,248 | $26,459 | $4,200 | $22,259 |
| 2023 | $1,248 | $26,459 | $4,200 | $22,259 |
| 2022 | $1,337 | $26,459 | $4,200 | $22,259 |
| 2021 | $1,251 | $21,780 | $3,500 | $18,280 |
| 2020 | $870 | $21,780 | $3,500 | $18,280 |
| 2019 | $870 | $21,780 | $3,500 | $18,280 |
| 2018 | $895 | $21,780 | $3,500 | $18,280 |
| 2017 | $866 | $21,780 | $3,500 | $18,280 |
| 2016 | $1,066 | $20,460 | $3,800 | $16,660 |
| 2015 | $974 | $20,459 | $3,800 | $16,659 |
| 2014 | $974 | $19,169 | $3,800 | $15,369 |
Source: Public Records
Map
Nearby Homes
- 519 Hillcrest Rd
- 2520 Austin Oaks Dr
- 616 E Woodruff Ave
- 109 Pamela Ln
- 14 Pamela Ln
- 222 Gragson Ave
- 1909 Windridge Ct
- 9318 Woodbine Sttreet
- 2949 Maelstrom Cir
- 59 Wesley Dr
- 9125 Woodbine St
- Lot 30 Hidden Creek Dr
- 2117 Ingleside Dr
- 10732 Rocky Creek Dr
- 10724 Rocky Creek Dr
- 9460 Robin Ln
- Lot 4 Johnson Dr
- 00 Johnson Dr
- Lot 2 Johnson Dr
- Lot 6 Johnson Dr
- 419 Hillwood Dr
- 511 Hillwood Dr
- 405 Hillwood Dr
- 508 Hillwood Dr
- 504 Hillwood Dr
- 513 Hillwood Dr
- 414 Hillwood Dr
- 510 Hillwood Dr
- 412 Hillwood Dr
- 500 Hillwood Dr
- 406 Hillwood Dr
- 424 Hillwood Dr
- 512 Hillwood Dr
- 422 Hillcrest Rd
- 400 Hillwood Dr
- 321 Hillwood Dr
- 514 Hillwood Dr
- 523 Hillwood Dr
- 324 Hillwood Dr
- 319 Hillwood Dr