5015 W 16th St Santa Ana, CA 92703
Riverview West NeighborhoodEstimated Value: $824,000 - $1,094,956
--
Bed
3
Baths
1,852
Sq Ft
$510/Sq Ft
Est. Value
About This Home
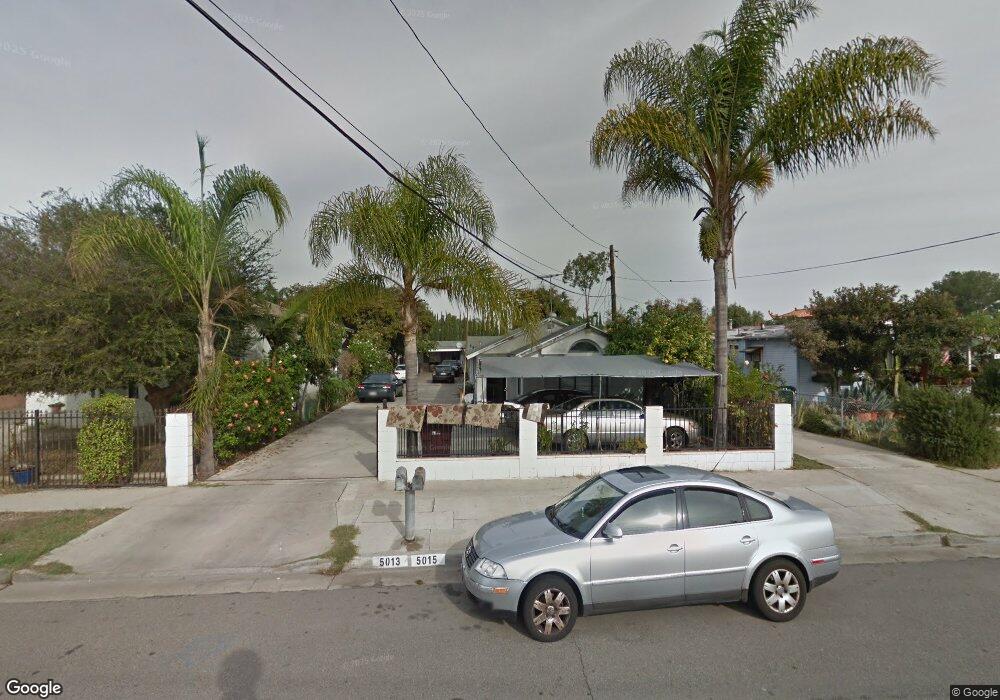
This home is located at 5015 W 16th St, Santa Ana, CA 92703 and is currently estimated at $943,989, approximately $509 per square foot. 5015 W 16th St is a home located in Orange County with nearby schools including Woodbury Elementary School, James Irvine Intermediate School, and Bolsa Grande High School.
Ownership History
Date
Name
Owned For
Owner Type
Purchase Details
Closed on
Sep 14, 2006
Sold by
Vu La Jimmy and Vu La Jeannie
Bought by
Giang La Johnny and Vu La Diane
Current Estimated Value
Purchase Details
Closed on
May 22, 2004
Sold by
Lahoang Oanh Thi
Bought by
Lajimmy Vu and La Jeannie Vu
Purchase Details
Closed on
Apr 13, 2000
Sold by
V Lahoangoanh and Lam V
Bought by
Lahoang Oanh Thi
Home Financials for this Owner
Home Financials are based on the most recent Mortgage that was taken out on this home.
Original Mortgage
$160,000
Interest Rate
7.87%
Mortgage Type
Purchase Money Mortgage
Purchase Details
Closed on
Oct 24, 1994
Sold by
Kirker Frances O
Bought by
Lahoang Oanh Thi and La Lam
Home Financials for this Owner
Home Financials are based on the most recent Mortgage that was taken out on this home.
Original Mortgage
$84,000
Interest Rate
8.52%
Mortgage Type
Purchase Money Mortgage
Create a Home Valuation Report for This Property
The Home Valuation Report is an in-depth analysis detailing your home's value as well as a comparison with similar homes in the area
Home Values in the Area
Average Home Value in this Area
Purchase History
| Date | Buyer | Sale Price | Title Company |
|---|---|---|---|
| Giang La Johnny | -- | None Available | |
| Lajimmy Vu | -- | -- | |
| Lahoang Oanh Thi | -- | Southland Title Corporation | |
| Lahoang Oanh Thi | $105,000 | -- |
Source: Public Records
Mortgage History
| Date | Status | Borrower | Loan Amount |
|---|---|---|---|
| Previous Owner | Lahoang Oanh Thi | $160,000 | |
| Previous Owner | Lahoang Oanh Thi | $84,000 |
Source: Public Records
Tax History Compared to Growth
Tax History
| Year | Tax Paid | Tax Assessment Tax Assessment Total Assessment is a certain percentage of the fair market value that is determined by local assessors to be the total taxable value of land and additions on the property. | Land | Improvement |
|---|---|---|---|---|
| 2025 | $6,746 | $568,711 | $488,385 | $80,326 |
| 2024 | $6,746 | $557,560 | $478,809 | $78,751 |
| 2023 | $6,621 | $546,628 | $469,421 | $77,207 |
| 2022 | $6,472 | $535,910 | $460,216 | $75,694 |
| 2021 | $6,385 | $525,402 | $451,192 | $74,210 |
| 2020 | $6,307 | $520,015 | $446,565 | $73,450 |
| 2019 | $6,225 | $509,819 | $437,809 | $72,010 |
| 2018 | $6,071 | $499,823 | $429,224 | $70,599 |
| 2017 | $6,012 | $490,023 | $420,808 | $69,215 |
| 2016 | $5,748 | $480,415 | $412,557 | $67,858 |
| 2015 | $5,674 | $473,199 | $406,360 | $66,839 |
| 2014 | $5,541 | $463,930 | $398,400 | $65,530 |
Source: Public Records
Map
Nearby Homes
- 11321 Parkgreen Ln Unit 102
- 1609 N Parsons Place
- 13322 Euclid St
- 14376 Euclid St Unit 1-4
- 10886 Lotus Dr
- 14356 Taft St
- 13611 Glenhaven Dr
- 14151 Lake St
- 1114 N Gates St
- 5317 Silver Dr
- 5405 W 4th St
- 4832 W 5th St Unit B
- 323 N Euclid St Unit 99
- 13312 Michael Rainford Cir
- 4201 W 5th St Unit 314
- 526 W Tribella Ct
- 13372 Jessica Dr
- 4248 W 5th St
- 1314 N Bewley St
- 3929 W 5th St Unit 16