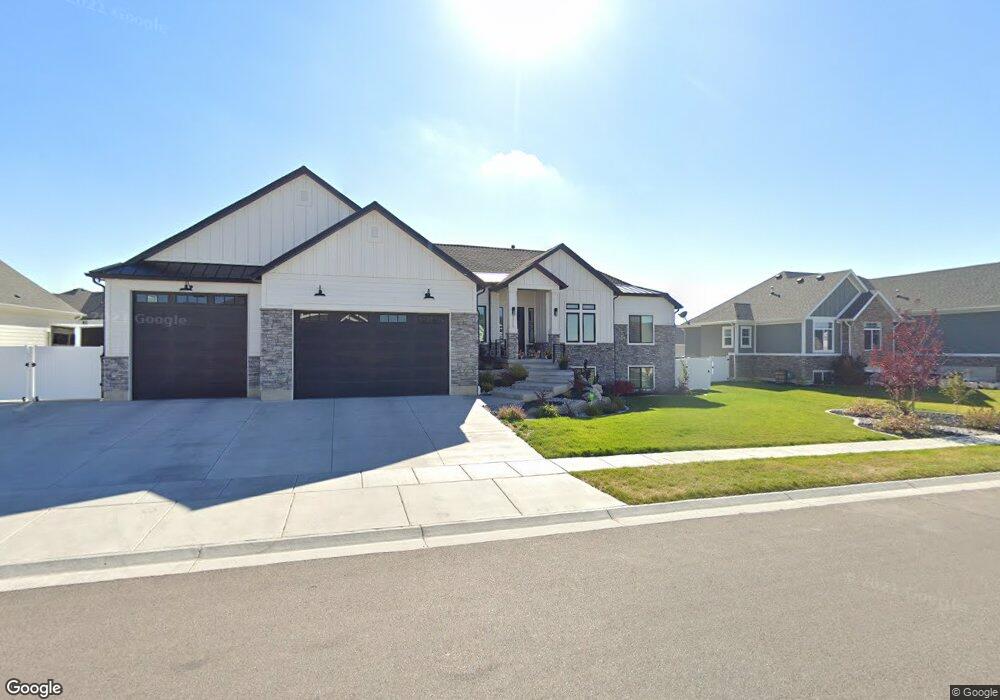
5015 W 3500 S West Haven, UT 84401
Estimated Value: $652,000 - $746,569
4
Beds
3
Baths
2,086
Sq Ft
$341/Sq Ft
Est. Value
About This Home
This home is located at 5015 W 3500 S, West Haven, UT 84401 and is currently estimated at $710,642, approximately $340 per square foot. 5015 W 3500 S is a home with nearby schools including Country View School, Rocky Mountain Junior High School, and Fremont High School.
Ownership History
Date
Name
Owned For
Owner Type
Purchase Details
Closed on
Jun 5, 2020
Sold by
Kapp Carson and Kapp Kellie M
Bought by
Kapp Carson B and Kapp Kellie M
Current Estimated Value
Home Financials for this Owner
Home Financials are based on the most recent Mortgage that was taken out on this home.
Original Mortgage
$381,250
Outstanding Balance
$337,949
Interest Rate
3.2%
Mortgage Type
New Conventional
Estimated Equity
$372,693
Purchase Details
Closed on
Jan 9, 2018
Sold by
Kapp Carson B
Bought by
Kapp Carson and Kapp Kellie M
Home Financials for this Owner
Home Financials are based on the most recent Mortgage that was taken out on this home.
Original Mortgage
$385,000
Interest Rate
3.5%
Mortgage Type
Adjustable Rate Mortgage/ARM
Purchase Details
Closed on
Apr 24, 2017
Sold by
Hamblinninvestments Inc
Bought by
Kapp Carson and Kapp Kellie M
Purchase Details
Closed on
Feb 22, 2017
Sold by
Green Phil H
Bought by
Hamblin Investments Inc
Create a Home Valuation Report for This Property
The Home Valuation Report is an in-depth analysis detailing your home's value as well as a comparison with similar homes in the area
Home Values in the Area
Average Home Value in this Area
Purchase History
| Date | Buyer | Sale Price | Title Company |
|---|---|---|---|
| Kapp Carson B | -- | Hickman Land Title Layton | |
| Kapp Carson | -- | Hickman Land Title Co | |
| Kapp Carson B | -- | Hickman Land Title Co | |
| Kapp Carson | -- | None Available | |
| Hamblin Investments Inc | -- | None Available |
Source: Public Records
Mortgage History
| Date | Status | Borrower | Loan Amount |
|---|---|---|---|
| Open | Kapp Carson B | $381,250 | |
| Closed | Kapp Carson B | $385,000 |
Source: Public Records
Tax History Compared to Growth
Tax History
| Year | Tax Paid | Tax Assessment Tax Assessment Total Assessment is a certain percentage of the fair market value that is determined by local assessors to be the total taxable value of land and additions on the property. | Land | Improvement |
|---|---|---|---|---|
| 2025 | $4,037 | $689,685 | $204,561 | $485,124 |
| 2024 | $3,867 | $372,899 | $112,589 | $260,310 |
| 2023 | $3,849 | $415,250 | $112,482 | $302,768 |
| 2022 | $4,427 | $441,100 | $109,816 | $331,284 |
| 2021 | $3,357 | $561,000 | $129,095 | $431,905 |
| 2020 | $3,225 | $494,000 | $109,724 | $384,276 |
| 2019 | $3,109 | $450,000 | $99,690 | $350,310 |
| 2018 | $3,163 | $470,000 | $99,690 | $370,310 |
| 2017 | $0 | $0 | $0 | $0 |
Source: Public Records
Map
Nearby Homes
- 4838 W 3625 S
- 3731 S 4975 W
- 3660 S 4700 W
- 3243 S 4950 W Unit 25
- 3263 S 4950 W Unit 24
- 3225 S 4950 W Unit 26
- 3198 S 4950 W Unit 29
- 3192 S 4950 W Unit 28
- 3238 S 4950 W
- 3245 S 4975 W
- 3223 S 4975 W Unit 15
- 3257 S 4975 W Unit 12
- 3269 S 4975 W Unit 11
- 3233 S 4975 W Unit 14
- 3215 S 4950 W Unit 27
- 3678 S 4625 W Unit 225
- 3686 S 4625 W Unit 227
- 3690 S 4625 W Unit 228
- 4622 W 3725 S Unit 231
- 3570 S 5425 W
- 4925 W 3500 S
- 5029 W 3500 S
- 5029 W 3500 S Unit 46
- 3521 S 4980 W
- 5022 W 3500 S
- 5002 W 3500 S Unit 55
- 4943 W 3500 S
- 3516 S 5050 W
- 5032 W 3500 S
- 3524 S 5050 W Unit 67
- 3524 S 5050 W
- 4948 W 3500 S Unit 57
- 3527 S 4980 W
- 3524 S 5050 W Unit 67
- 5046 W 3500 S
- 3528 S 4980 W
- 3530 S 5050 W Unit 68
- 4938 W 3500 S Unit 57
- 4911 W 3500 S
- 3519 S 4900 W Unit 41