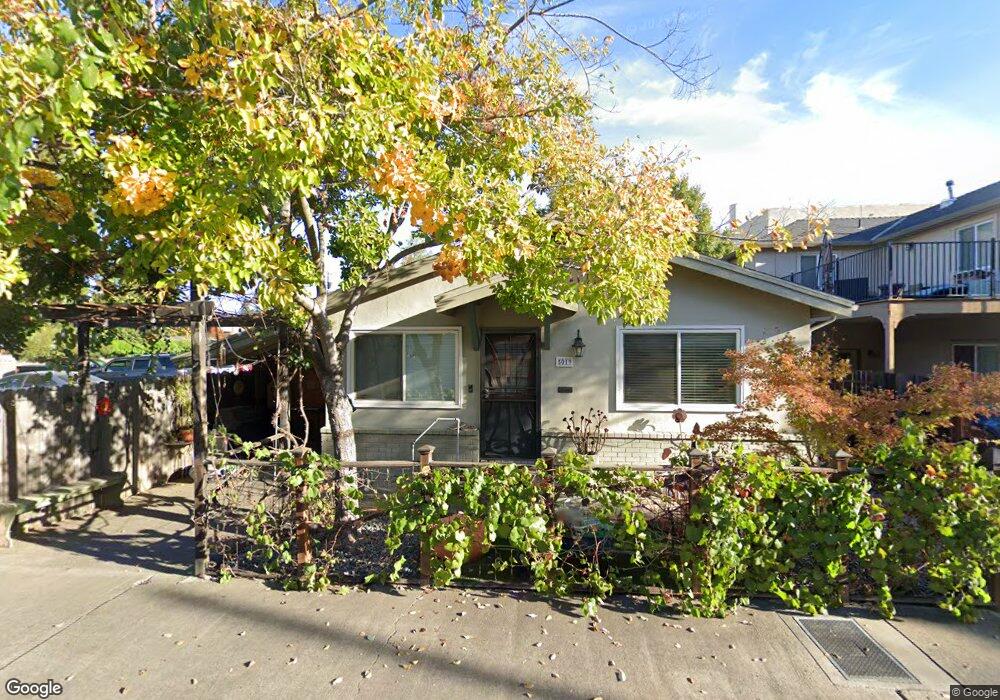
5019 Dover Ave Sacramento, CA 95819
East Sacramento NeighborhoodEstimated Value: $479,330 - $596,000
2
Beds
1
Bath
800
Sq Ft
$659/Sq Ft
Est. Value
About This Home
This home is located at 5019 Dover Ave, Sacramento, CA 95819 and is currently estimated at $526,833, approximately $658 per square foot. 5019 Dover Ave is a home located in Sacramento County with nearby schools including Caleb Greenwood Elementary, Umoja International Academy, and Hiram W. Johnson High School.
Ownership History
Date
Name
Owned For
Owner Type
Purchase Details
Closed on
Aug 3, 2016
Sold by
Tanghetti Angela M
Bought by
Tanghetti Angela M and Tanghetti Revocable T Angela M
Current Estimated Value
Purchase Details
Closed on
Feb 2, 2004
Sold by
Dallosta James E and Dallosta Genevieve M
Bought by
Tanghetti Angela M
Purchase Details
Closed on
Aug 19, 1994
Sold by
Dallosta James E and Dallosta Genevieve
Bought by
Dallosta James E and Dallosta Genevieve M
Purchase Details
Closed on
Aug 13, 1993
Sold by
Tanghetti Emil M and Tanghetti Rose
Bought by
Tanghetti Emil M and Tanghetti Rose
Create a Home Valuation Report for This Property
The Home Valuation Report is an in-depth analysis detailing your home's value as well as a comparison with similar homes in the area
Home Values in the Area
Average Home Value in this Area
Purchase History
| Date | Buyer | Sale Price | Title Company |
|---|---|---|---|
| Tanghetti Angela M | -- | None Available | |
| Tanghetti Angela M | -- | Sierra Valley Title Company | |
| Dallosta James E | -- | -- | |
| Tanghetti Emil M | -- | -- |
Source: Public Records
Tax History Compared to Growth
Tax History
| Year | Tax Paid | Tax Assessment Tax Assessment Total Assessment is a certain percentage of the fair market value that is determined by local assessors to be the total taxable value of land and additions on the property. | Land | Improvement |
|---|---|---|---|---|
| 2025 | $3,207 | $277,766 | $107,255 | $170,511 |
| 2024 | $3,207 | $272,320 | $105,152 | $167,168 |
| 2023 | $3,130 | $266,982 | $103,091 | $163,891 |
| 2022 | $3,076 | $261,748 | $101,070 | $160,678 |
| 2021 | $2,928 | $256,617 | $99,089 | $157,528 |
| 2020 | $2,952 | $253,986 | $98,073 | $155,913 |
| 2019 | $2,888 | $249,006 | $96,150 | $152,856 |
| 2018 | $2,811 | $244,124 | $94,265 | $149,859 |
| 2017 | $2,770 | $239,338 | $92,417 | $146,921 |
| 2016 | $2,703 | $234,646 | $90,605 | $144,041 |
| 2015 | $2,662 | $231,187 | $89,276 | $141,911 |
| 2014 | $2,589 | $226,660 | $87,528 | $139,132 |
Source: Public Records
Map
Nearby Homes