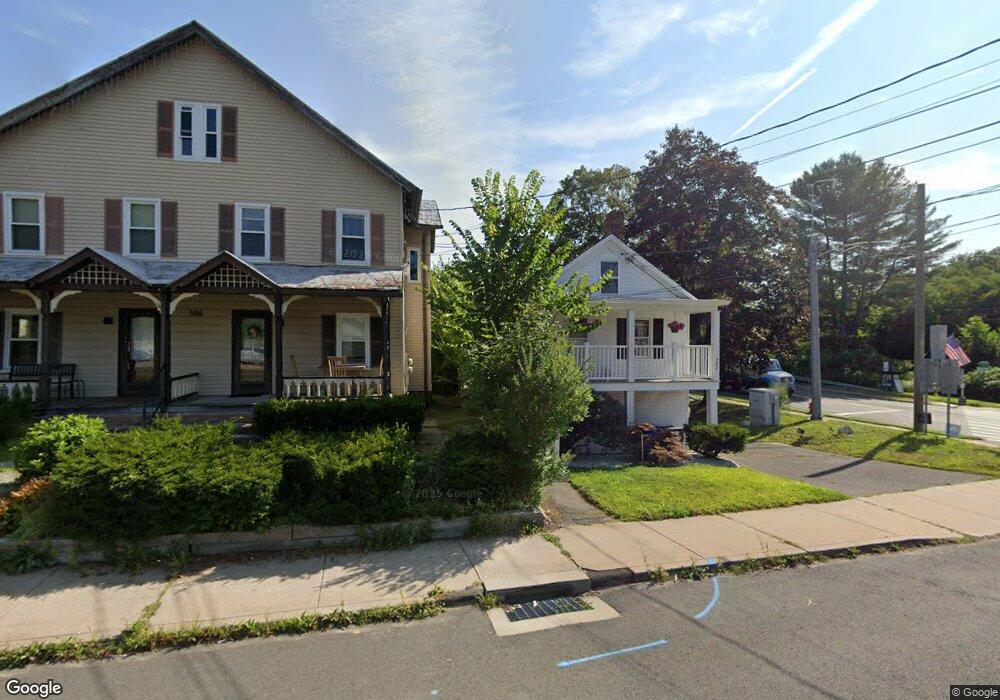
502 Main St New Hartford, CT 06057
Estimated Value: $251,727
--
Bed
2
Baths
1,566
Sq Ft
$161/Sq Ft
Est. Value
About This Home
This home is located at 502 Main St, New Hartford, CT 06057 and is currently priced at $251,727, approximately $160 per square foot. 502 Main St is a home located in Litchfield County with nearby schools including Ann Antolini School, Northwestern Regional Middle School, and Northwestern Regional High School.
Ownership History
Date
Name
Owned For
Owner Type
Purchase Details
Closed on
Jun 27, 2024
Sold by
Vhc Realty Inc
Bought by
502 Main St Llc
Current Estimated Value
Home Financials for this Owner
Home Financials are based on the most recent Mortgage that was taken out on this home.
Original Mortgage
$281,500
Outstanding Balance
$278,157
Interest Rate
7.02%
Mortgage Type
Commercial
Purchase Details
Closed on
Sep 10, 1986
Bought by
Vhc Realty
Create a Home Valuation Report for This Property
The Home Valuation Report is an in-depth analysis detailing your home's value as well as a comparison with similar homes in the area
Home Values in the Area
Average Home Value in this Area
Purchase History
| Date | Buyer | Sale Price | Title Company |
|---|---|---|---|
| 502 Main St Llc | $250,000 | None Available | |
| Vhc Realty | -- | -- |
Source: Public Records
Mortgage History
| Date | Status | Borrower | Loan Amount |
|---|---|---|---|
| Open | 502 Main St Llc | $281,500 | |
| Previous Owner | Vhc Realty | $105,370 |
Source: Public Records
Tax History Compared to Growth
Tax History
| Year | Tax Paid | Tax Assessment Tax Assessment Total Assessment is a certain percentage of the fair market value that is determined by local assessors to be the total taxable value of land and additions on the property. | Land | Improvement |
|---|---|---|---|---|
| 2025 | $4,165 | $146,300 | $53,900 | $92,400 |
| 2024 | $3,776 | $138,110 | $53,900 | $84,210 |
| 2023 | $3,883 | $117,600 | $51,940 | $65,660 |
| 2022 | $3,800 | $117,600 | $51,940 | $65,660 |
| 2021 | $3,837 | $117,600 | $51,940 | $65,660 |
| 2020 | $3,802 | $117,600 | $51,940 | $65,660 |
| 2019 | $3,757 | $117,600 | $51,940 | $65,660 |
| 2018 | $3,762 | $116,410 | $51,940 | $64,470 |
| 2017 | $3,634 | $116,410 | $51,940 | $64,470 |
| 2016 | $3,623 | $116,410 | $51,940 | $64,470 |
| 2015 | $3,439 | $116,410 | $51,940 | $64,470 |
| 2014 | $3,339 | $116,410 | $51,940 | $64,470 |
Source: Public Records
Map
Nearby Homes